Figure 5.
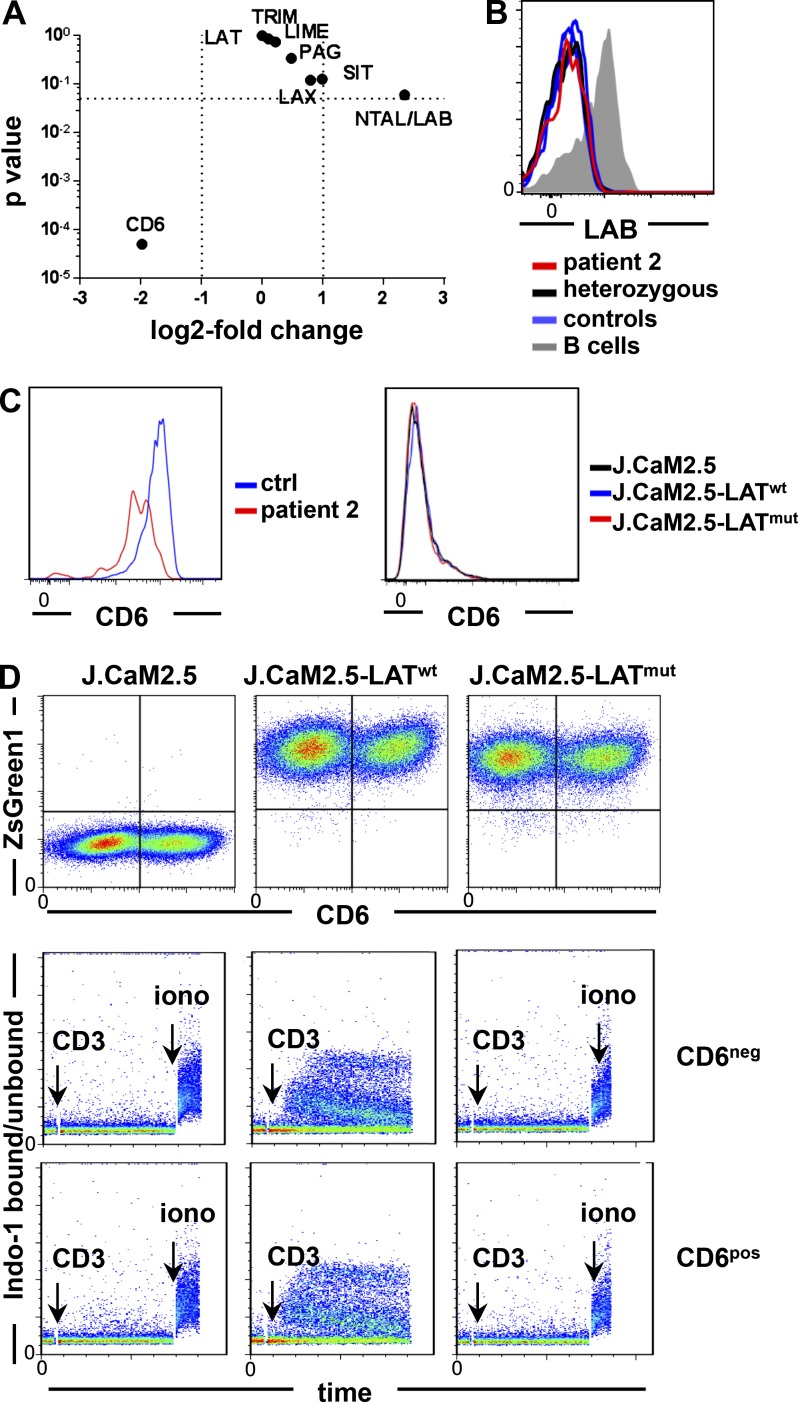
Analysis of alternative adapter molecules in LAT-mutated T cells. (A) Volcano plot displaying the p-value versus log2 fold change in gene expression of selected adapter molecules in CD4 CD45R0 T cells of patient 2 compared with the mean expression value (base mean) of two controls determined by RNA sequencing. (B) Expression of LAB/NTAL in patient 2, the heterozygous sibling, and three controls. (C) CD6 expression in primary T cells of patient 2 and a healthy control (ctrl) and in LAT-transduced or nontransduced J.CaM2.5 cell lines (representative of two and four independent experiments, respectively). (D) CD6 and ZsGreen1 expression after transduction of a CD6 expression vector in J.CaM2.5, J.CaM2.5-LATwt, and J.CaM2.5-LATmut cells (top). Ca2+ mobilization in CD6-negative (CD6neg) versus CD6-positive (CD6pos) J.CaM2.5, J.CaM2.5-LATwt, and J.CaM2.5-LATmut cells after anti-CD3 stimulation (bottom). The results are representative of four independent experiments. iono, ionomycin.

