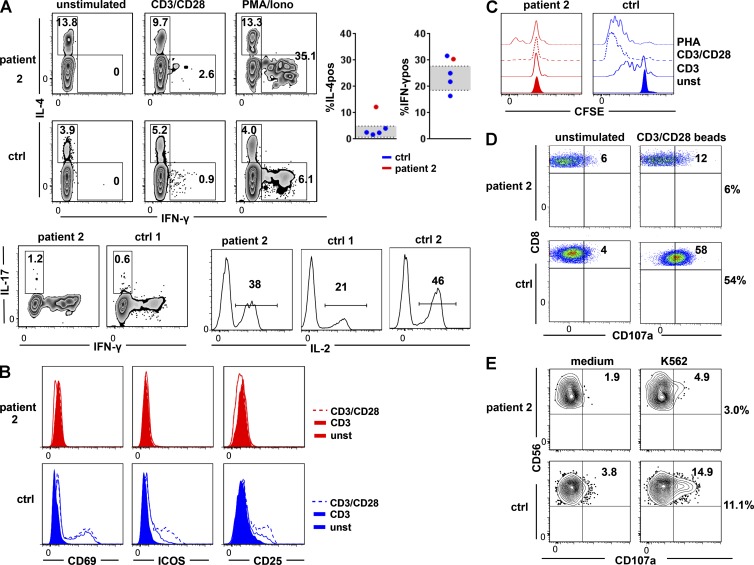
Figure 6.
Lymphocyte function. (A) IL-4 and IFN-γ production in the unstimulated situation and after stimulation with PMA/ionomycin in the LAT-mutated patient and a control (top). The graphs show the percentage of IL-4– (IL-4pos) and IFN-γ–positive (IFN-γpos) cells of CD4 CD45R0 T cells in patient 2 (red) compared with healthy day controls (blue). The standard deviation of 58 healthy controls is depicted in gray. IL-17 (bottom left) and IL-2 (bottom right) production after PMA/ionomycin (Iono) treatment in CD45R0 CD4 T cells of patient 2 and one or two controls, respectively. Numbers indicate the percentage of positive cells in the respective parental subpopulation (three independent experiments). (B) Up-regulation of CD69, ICOS, and CD25 in the LAT-mutated patient (red) and a control (blue) after stimulation with anti-CD3 (continuous line) and anti-CD3/anti-CD28 (dashed line). Results are representative of two independent experiments. (C) Proliferation of CD4 T cells after stimulation with anti-CD3, anti-CD3/anti-CD28, and PHA (two independent experiments). unst, unstimulated. (D) CTL degranulation is shown by the up-regulation of CD107a in CD8 T cells after stimulation with CD3/CD28 beads. (E) NK cell degranulation measured by the surface expression of CD107a after incubation of PBMCs with K562 target cells (two independent experiments). ctrl, control.

