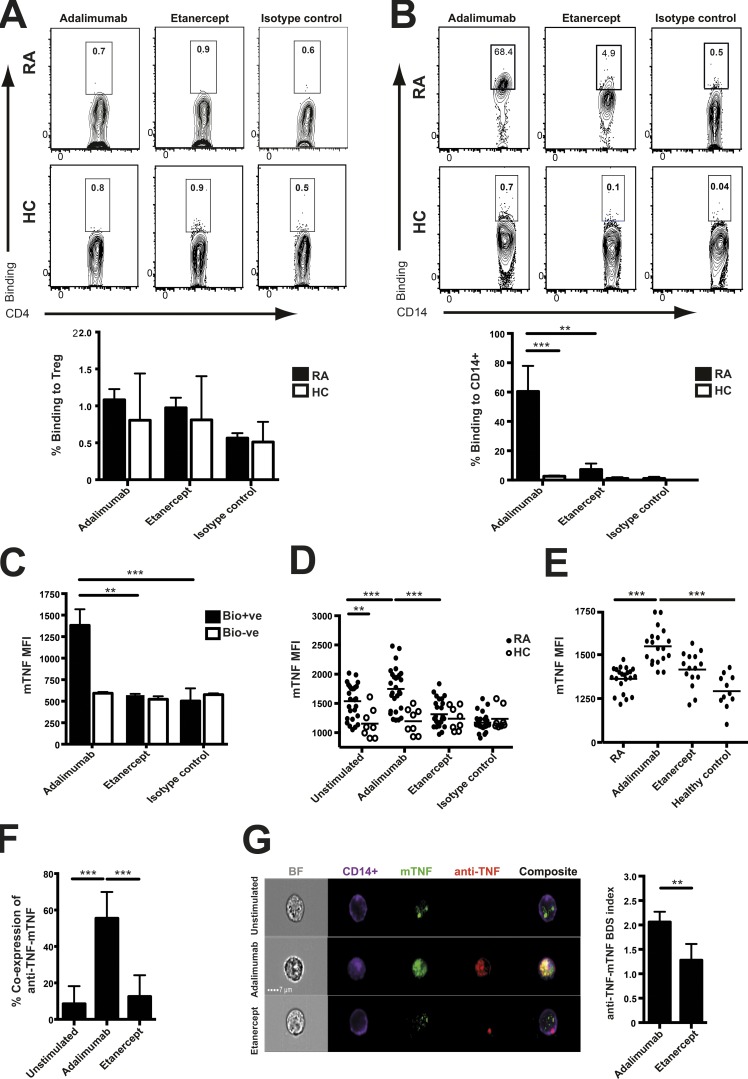
Figure 3.
Adalimumab bound to membrane TNF on RA monocytes. (A and B) Adalimumab and etanercept were biotinylated and added to purified CD4+CD25+CD127− T reg cells (A) or purified CD14+ monocytes (B) from RA patients and healthy controls (HC) for 30 min. Bound adalimumab and etanercept were detected using an APC-streptavidin secondary antibody. Representative plots and cumulative data depict percentage of binding of each anti-TNF agent to T reg cells from RA patients (n = 12) and healthy individuals (n = 10; A) and to monocytes (number of RA = 8; number of healthy controls = 10; B). (C) The bars depict membrane TNF (mTNF) mean fluorescence intensity (MFI) on RA monocytes either bound (Bio+ve) or unbound (Bio−ve) by biotinylated adalimumab for 30 min (n = 11). (D) Membrane TNF expression on purified CD14+ monocytes from RA patients (n = 28) and healthy controls (n = 8) exposed for 24 h to adalimumab, etanercept, or isotype control. (E) Ex vivo expression of monocyte membrane TNF from RA patients with active disease (n = 23), adalimumab responders (n = 19), etanercept responders (n = 15), and healthy individuals (n = 11). (F) Purified monocytes were stained for CD14+ and membrane TNF after co-culture with biotinylated adalimumab or etanercept for 30 min. ImageStream cumulative data indicate coexpression of membrane TNF and either adalimumab or etanercept on monocytes. Unstimulated are shown as background (n = 5). (G) The ImageStream gallery includes brightfield (BF), CD14, membrane TNF, biotinylated adalimumab, and etanercept (anti-TNF), composite merged images. The bars depict the BDS index (colocalization) of adalimumab and etanercept with membrane TNF occurring at the surface of CD14+ monocytes (n = 5). Data in A–C were obtained from three experimental repeats. Data in D and E were from six and F and G were from two experimental repeats. **, P < 0.01; ***, P < 0.001 using Kruskal-Wallis (A–D, F, and G) or Friedman tests (E) with Dunn’s post-hoc analysis. Error bars represent mean ± SE.

