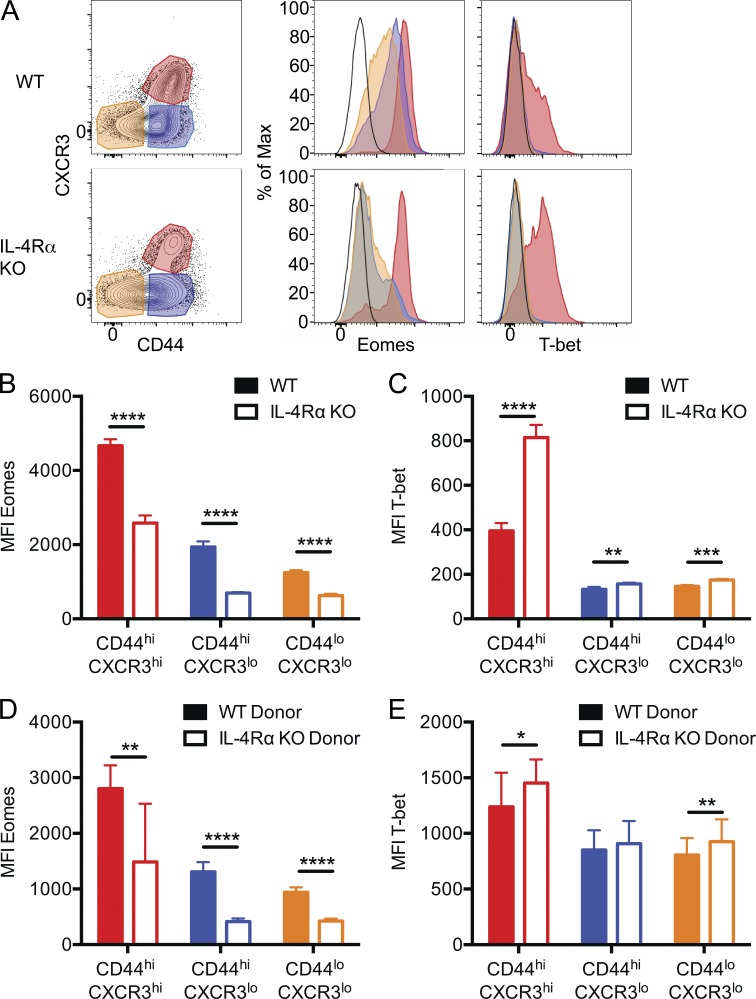
Figure 3.
IL-4Rα regulates Eomes and T-bet expression by all CD8+ T cell subsets. (A) Cells were isolated from naive WT and IL-4Rα KO BALB/cByJ spleen and lymph nodes, and CD8+ T cells with the indicated CXCR3/CD44 phenotype were analyzed for Eomes and T-bet expression after intracellular staining. The black line (unfilled) represents naive CD4 T cells as a control. (B–E) The mean fluorescence intensity (MFI) for expression of Eomes (B and D) and T-bet (C and E) was determined in CD8+ T cells from intact WT BALB/cByJ and IL-4Rα KO BALB/cByJ mice (B and C) and from mixed BM chimeras, generated as in Fig. 1 (D and E). Error bars indicate mean ± SD. P-values are represented as *, P < 0.05; **, P < 0.001; ***, P < 0.001; ****, P < 0.0001 by unpaired (B and C) or paired (D and E) Student’s t test. (B and C) n = 4 for WT and n = 4 for IL-4Rα KO, and data are representative of four experiments. (D and E) n = 7 for mixed BM chimeras, and data are representative of three experiments.

