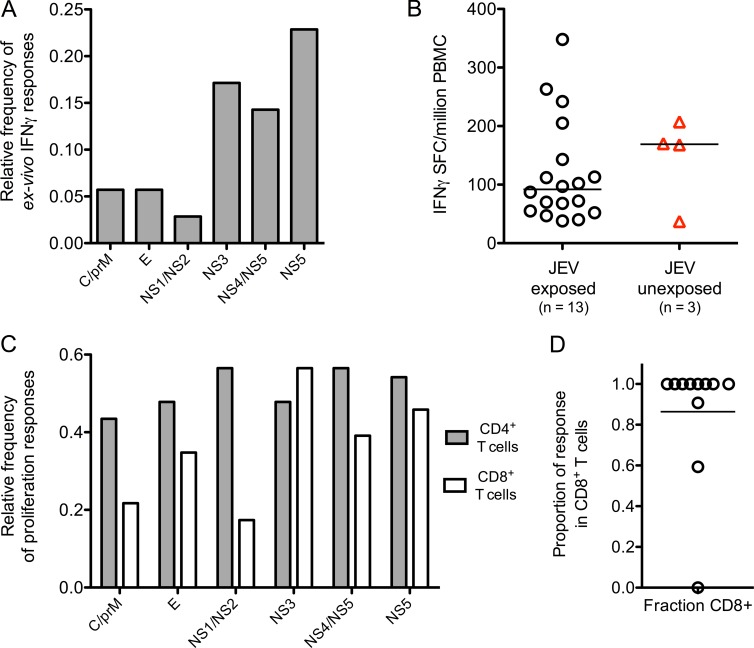
Figure 1.
Breadth of the T cell response to peptide pools of JEV in JEV-exposed healthy donors. (A) Relative frequency of ex vivo IFN-γ responses were measured by ELISPOT or ICS in JEV-exposed healthy donors (n = 35, 29 for ELISPOT, and 6 for ICS). Peptide pools are shown grouped by viral proteins. For a subset of five subjects, ICS and ELISPOT were performed at least three times with consistent results. C, core. E, envelope. (B) Spot-forming cells (SFCs) per million PBMCs were measured by ELISPOT in 13 healthy JEV-exposed donors (18 responses, black circles) and three DENV-exposed subjects (four responses, red triangles). (C) Proliferative responses were measured by CFSE dilution and flow cytometry in healthy JEV-exposed donors once per subject. Data are relative frequency (n = 24) for CD4+ and CD8+ T cells. (D) Based on data from ICS assays, the proportion of the total IFN-γ response produced by CD8+ T cells in each healthy JEV-exposed donor was calculated. The bar depicts the median. n = 11.

