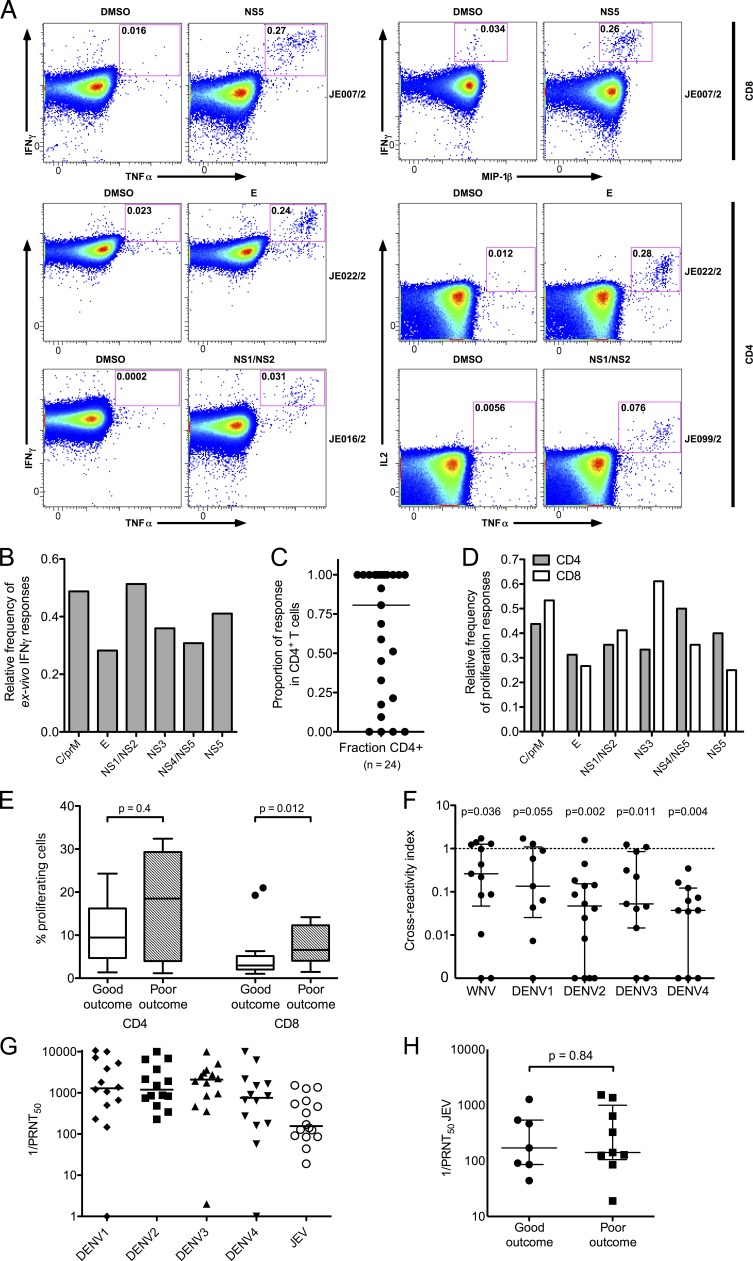
Figure 5.
Breadth of the T cell response to JEV peptide pools in recovered JE patients. (A) WB ICS assays were used to measure cytokine+ cells in recovered JE patients. Example flow cytometry data from four patients are shown. Axes are log10 fluorescence units. (Top) CD8+ responses, IFN-γ versus TNF-α (left) and IFN-γ versus MIP-1β (right). (Bottom) CD4+ responses, IFN-γ versus TNF-α (left) and IL2 versus TNF-α (right). (B) Ex vivo IFN-γ responses from 39 recovered JE patients were measured by ELISPOT (n = 17) or ICS (n = 22), and relative frequency of responses to each peptide pool was calculated. (C) The relative proportion of the cytokine response produced by CD4+ T cells in individual patients was measured by ICS in the same experiments as in A and B. The bar depicts the median. (D) Proliferation responses were measured by CFSE dilution and flow cytometry in 18 recovered JE patients of whom 15 showed responses. The relative frequency for CD4+ T cells and CD8+ T cells is shown. (E) Proliferative responses from the same experiments as in D were equal in size between good outcome and poor outcome for CD4+ cells (25 responses in eight patients with good outcome and 13 responses in four patients with poor outcome; Mann Whitney U test); CD8+ responses were larger in poor outcome (23 responses in eight patients with good outcome and 17 responses in six patients with poor outcome). The bars depict the median and IQR, whiskers are 1.5 × IQR, and outliers are shown as points. (F) Cross-reactivity of short-term T cell lines expanded with JEV peptides with DENV1–4 and WNV were measured by ICS. Data are cross-reactivity indices (as in Fig. 2 E) of 14 T cell responses identified in seven recovered JE patients. Wilcoxon signed rank tests showed significant differences from a hypothetical value of 1 (i.e., the response to JEV and variant peptides was not equivalent) for all viruses except DENV1. Number of peptides tested: WNV = 13; DENV1 = 9; DENV2 = 14; DENV3 = 11; DENV4 = 11. (G) NAbs against JEV and all four DENV serotypes were measured by PRNT50. The bars depict the median. Assays were generally performed once per person, and nine subjects had some assays repeated with similar results. (H) JEV PRNT50 were the same in JE patients with good (n = 7) and poor (n = 9) outcome (Mann Whitney U test). The bars depict the median and IQR. C, core protein. E, envelope protein.

