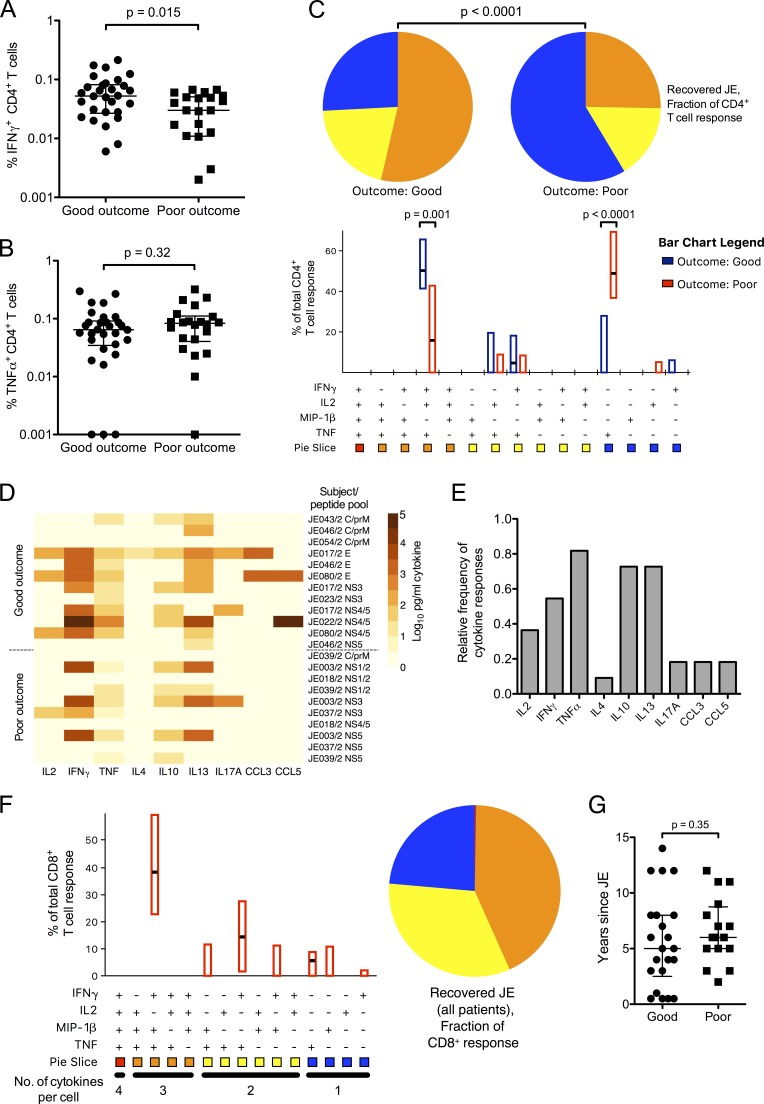
Figure 6.
T cell cytokine responses to JEV peptide pools in recovered JE patients. (A–C) Recovered JE patients showing CD4+ T cell responses were categorized into good outcome (complete recovery; n = 16) and poor outcome (recovery with residual neurological deficit/disability >6 mo after disease; n = 11). Cytokine responses were measured by WB ICS once per subject. 30 responses were detected in the good outcome group and 22 responses in the poor outcome group. (A) IFN-γ responses were smaller in those with poor outcome (Mann Whitey U test). (B) TNF-α responses showed no difference with outcome (Mann Whitey U test). (C) CD4+ T cell responses were analyzed using SPICE according to the outcome from JE. Patients with poor outcome had fewer polyfunctional cells (SPICE pie comparison, 10,000 replicates), with the difference largely accounted for by fewer IFN-γ+/TNF-α+/IL2+ cells (P = 0.001 for a Mann Whitney U test) and more TNF-α+ cells (P < 0.0001). The data were analyzed for individual responses; summing by subjects retained the strong significance of the result. (D) Secreted cytokine concentrations were measured by bead array from 11 recovered JE patients after 5 d of stimulation with JEV peptide pools. The heat map depicts log10-transformed picograms/milliliter. Some subjects had more than one peptide pool assayed. Data are depicted after subtraction of values from unstimulated cells and are displayed according to outcome from JE. (Top) Good outcome, n = 7. (Bottom) Poor outcome, n = 4. This experiment was performed once. C, core protein. prM, pre-membrane protein. E, envelope protein. NS, non-structural protein. (E) Relative frequency of secreted cytokine responses from the same experiments as in D after 2 and 5 d of stimulation with JEV peptide pools. Subjects were considered positive if any pool was positive at either time point. (F) CD8+ T cell responses from recovered JE patients were assayed once per subject by WB ICS (n = 14; 18 responses) and analyzed using SPICE. (G) There was no difference in years since admission with clinical JE and sampling for this study between the good and poor outcome groups (Mann Whitney U test). Good outcome, n = 22. Poor outcome, n = 16.

