Figure 4.
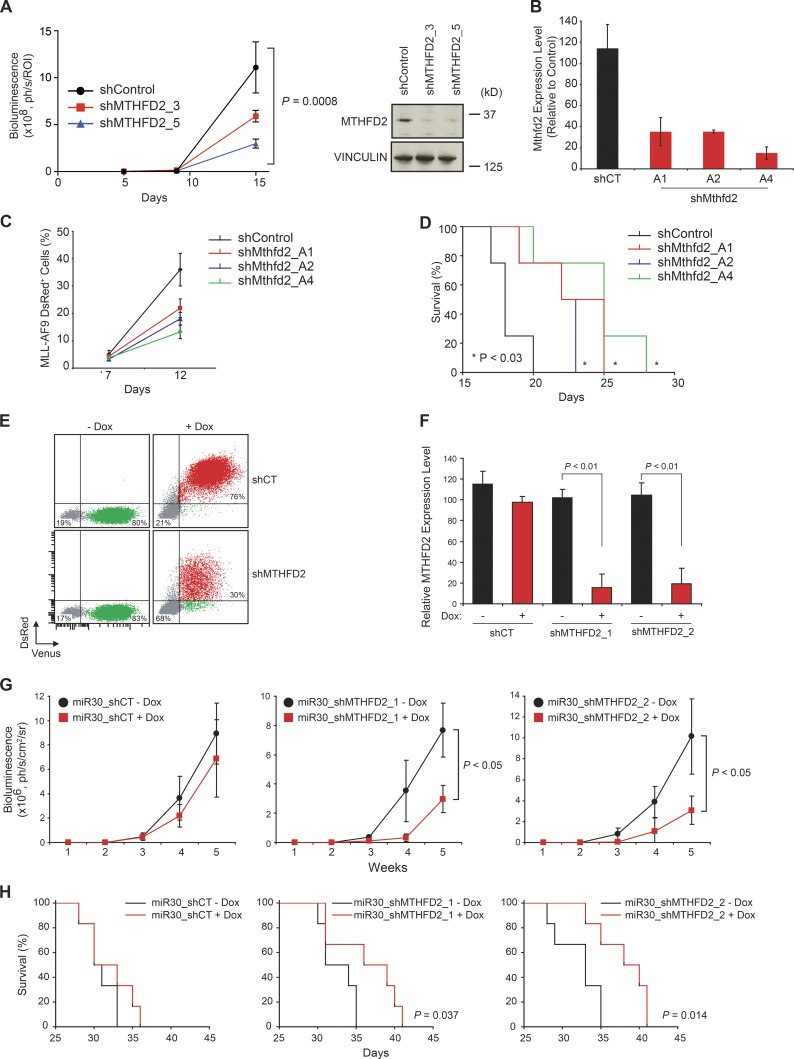
MTHFD2 knockdown impairs leukemia establishment and progression in vivo. (A) Graph depicting growth in mice of U937-LucNeo cells infected with MTHFD2-directed shRNA versus LacZ (shControl). Bioluminescence was quantified as a measure of disease burden. Data are represented as a mean ± SEM of six mice per cohort. Western blot shows MTHFD2 levels at the time of injection of cells. P = 0.0008 using two-way ANOVA. (B) RNA was isolated from mouse MLL-AF9 cells, and Mthfd2 suppression was confirmed at time of cell injection. (C) Graph showing percentage of MLL-AF9–positive cells in mouse peripheral blood with or without Mthfd2 suppression. Shown is mean percentage ± SD for four mice. (D) Kaplan-Meier curve showing overall survival of mice with MLL-AF9 leukemia after suppression of MTHFD2 versus shControl (n = 4 per group). P < 0.03 calculated using log-rank test. (E) FACS plot showing induction of shRNA with doxycycline treatment (DsRed+/Venus+). (F) qRT-PCR showing relative amount of MTHFD2 after treatment with doxycycline. Bar graphs represent mean value ± SD for four replicates. P < 0.01, Mann-Whitney test. (G) Graph depicting growth of U937-LucNeo cells transduced with a doxycycline-inducible TRMPVIR vector containing either a scrambled miR30-shRNA (shCT) or shRNAs directed against MTHFD2 after injection into Nude mice and treatment with doxycycline to induce shRNA expression. Graphs represent mean bioluminescence ± SD for six mice per group. P < 0.05, Mann-Whitney test at week 5. (H) Kaplan-Meier curves showing overall survival of mice (n = 6 per group). P = 0.037 for shMTHFD2_1 and P = 0.014 for shMTHFD2_2, calculated using log-rank test.

