Figure 5.
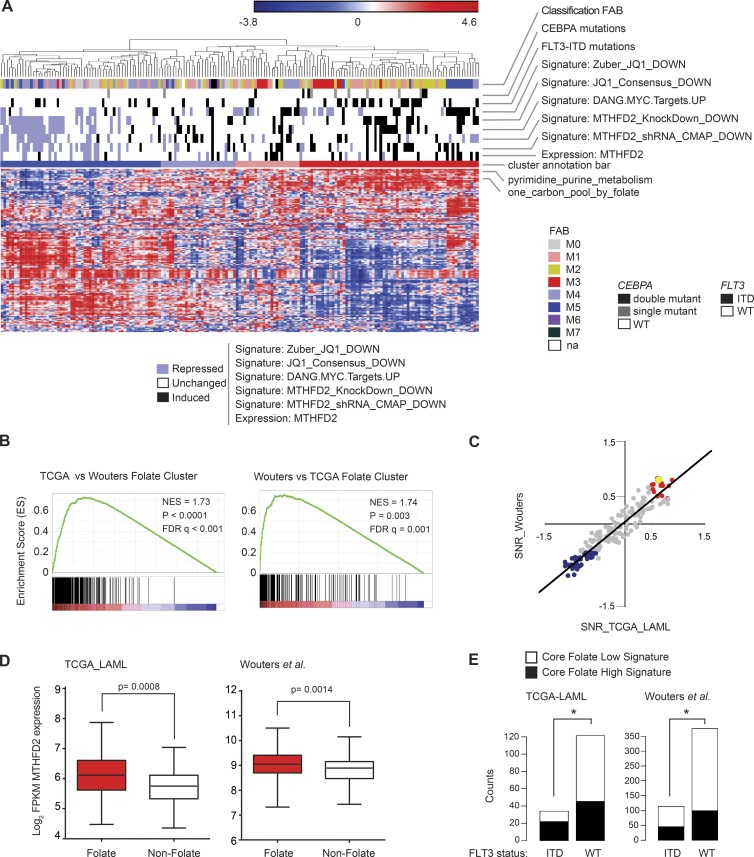
ssGSEA identifies a folate cluster and establishes FLT3-ITD as a sensitivity marker for MTHFD2 suppression. (A) Heat map of ssGSEA projection for the primary AML tumor dataset from TCGA on the collection of KEGG canonical pathways. Cluster annotation bar depicts consensus clusters and their degree of enrichment in the one-carbon folate pathway. Samples in the folate cluster are highlighted in red. Other annotation bars highlight enrichment in signatures of MTHFD2, JQ1 effect, MYC targets, mutations associated with folate cluster, and FAB subtypes. For each of these signatures, the enrichment was computed per primary tumor by applying the ssGSEA method. The level of enrichment was assessed based on the absolute cut-off value 1 applied to the ssGSEA z-scores: samples with ssGSEA z-scores ≥1 were labeled as significantly highly enriched in the signature and highlighted black, whereas samples with ssGSEA z-scores ≤−1 were labeled as significantly low enriched in the signature and highlighted blue. Samples that did not pass the significance cut-off were labeled as not significantly enriched and highlighted white. (B) GSEA cross-validation tests for consistency of the folate cluster signature across primary AML tumor datasets. Each GSEA plot shows enrichment of the folate cluster phenotype in one dataset with the gene signature of the folate cluster in the other dataset. P < 0.0001; P = 0.003, computed using the permutation test for gene set enrichment implemented in the GSEA v2.0.14 platform. (C) Scatter plot of differential KEGG pathway enrichment SNR scores for samples in the folate cluster versus all other samples in TCGA LAML versus Wouters et al. (2009) datasets. The regression line indicates the Pearson correlation coefficient R = 0.94 (P < 0.001, computed using the R v3.2 cor.test function, implemented in the library stats). Red dots correspond to KEGG pathways positively enriched in both TCGA LAML and Wouters et al. folate clusters. Blue dots correspond to KEGG pathways negatively enriched in both TCGA LAML and Wouters et al. folate clusters. The yellow highlighted dot corresponds to the one-carbon folate pathway. The complete descriptions of the KEGG pathways and of the differentially enriched scores in the two datasets are provided in Table S2. (D) Box plots showing MTHFD2 expression in the folate cluster, shown in red in A, compared with the nonfolate cluster, shown in dark blue in Panel A for TCGA and Wouters et al. datasets. P = 0.0008 for TCGA and P = 0.0014 for Wouters et al., Welch-corrected two-tailed Student’s t test. (E) Two-dimensional barplots depicting the results of two-tailed Fisher exact tests for enrichment of the folate cluster with FLT3-ITD mutations. *, P < 0.05, two-tailed Fisher’s exact test.

