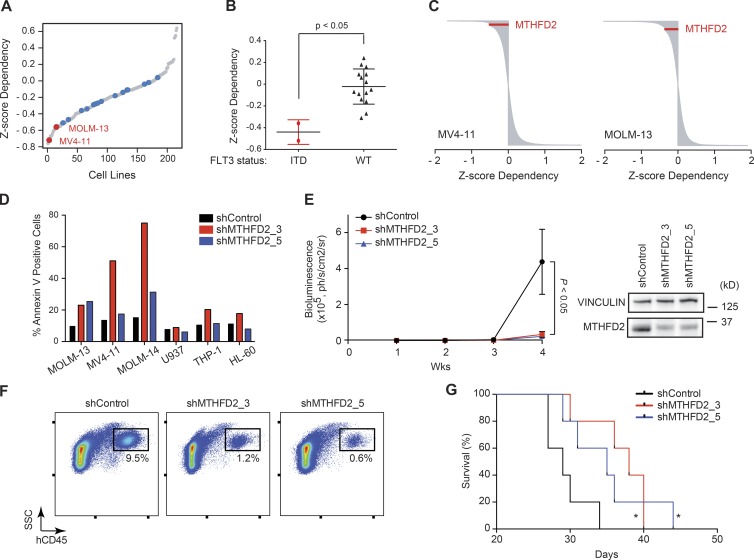
Figure 6.
FLT3-ITD is a marker of sensitivity for MTHFD2 suppression. (A) Ranking of MTHFD2 depletion score across 216 cell lines in a shRNA screen. Red dots represent FLT3-ITD–mutated AML cell lines. Blue dots represent other AML cell lines. Gray dots represent non-AML cell lines. (B) Box plots showing mean MTHFD2 dependency for AML cell lines. P < 0.05, Mann-Whitney test. (C) MTHFD2 ranks as 191 out of 11,946 (top 1.6%) dependency in the MV4-11 cell line and 575 out of 11,946 (top 4.8%) in the MOLM-13 cell line. MTHFD2 is shown in red among all shRNA rankings for each individual cell line. (D) Suppression of MTHFD2 causes significant apoptosis in FLT3-ITD mutant cell lines. Shown is percent Annexin V–positive cells per cell line with shControl, shMTHFD2_3, or shMTHFD2_5. Data show a representative experiment from at least three individual experiments. (E) Graph depicting growth in mice of MV4-11-LucNeo cells infected with MTHFD2-directed shRNA versus LacZ (shControl). Bioluminescence was quantified as a measure of disease burden. Data are represented as a mean ± SEM of four mice per cohort. P < 0.05 at Week 4, Mann-Whitney test. Western blot shows MTHFD2 level at time of injection of cells. (F) FACS plot showing percent of human CD45+ cells in bone marrow in mice injected with MV4-11-LucNeo cells, 16 d after injection. (G) Kaplan-Meier curve showing overall survival of mice with MV4-11-LucNeo cells after suppression of MTHFD2 versus shControl (n = 5 per group). *, P < 0.05 relative to control, calculated using log-rank test.

