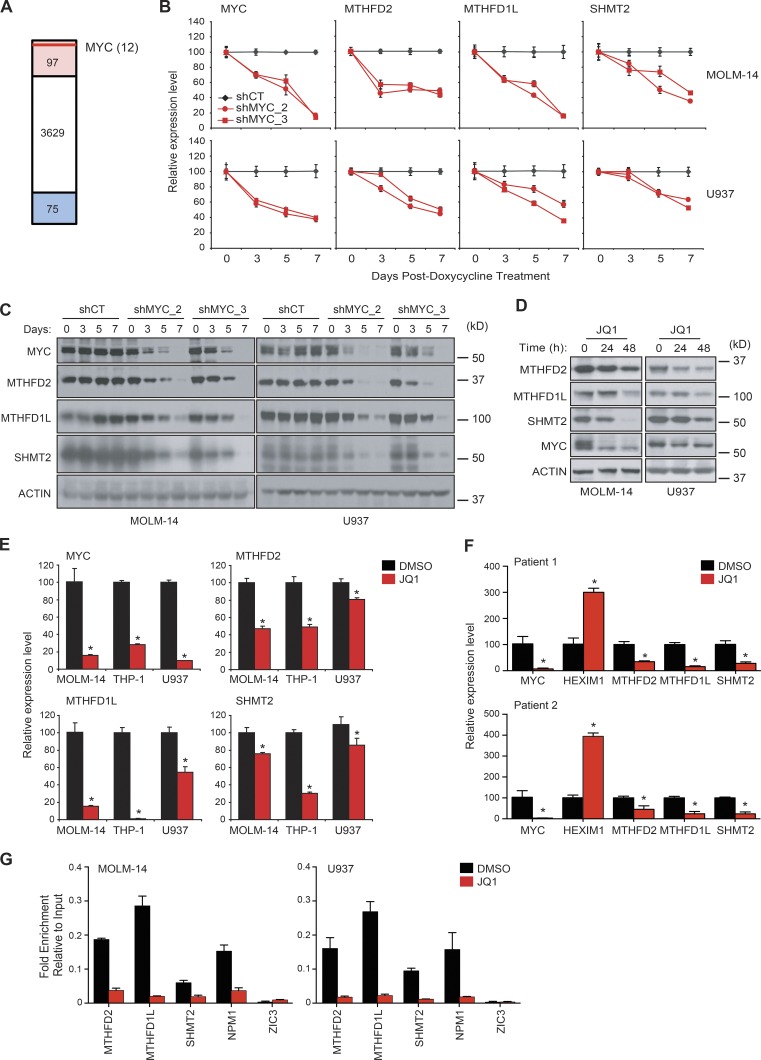
Figure 7.
MYC controls one-carbon folate pathway. (A) MTHFD2 knockdown signature was used to probe the Connectivity Map for targets that mimic the effect of MTHFD2 knockdown. Red highlights 97 shRNAs that are significantly enriched (CMap consensus score > 0.90) and blue shows shRNAs that are anticorrelated (CMap consensus score < −0.90). Red line represents relative position of MYC hairpin enrichment. (B) Two AML cell lines were transduced with two different doxycycline inducible miR30 shRNAs targeting MYC (shMYC_2 and shMYC_3). A scrambled miR30 shRNA was used as control (shCT). Gene expression of MYC, MTHFD2, MTHFD1L, and SHMT2 was measured by qRT-PCR. Shown are the mean ± SD of four replicate measurements. (C) Western blot of the treated cell lines confirms a reduction in target protein after doxycycline treatment. (D) Western blot of two AML cell lines treated with 1 µM JQ1 showing a time-dependent decrease in proteins of the mitochondrial one-carbon folate pathway. (E) Three AML cell lines were treated with 1 µM JQ1 versus vehicle and qRT-PCR was performed. *, P < 0.05, Mann-Whitney test. (F) Mononuclear cells extracted from two AML patient samples were treated with 1 µM JQ1 for 24 h. Target gene expression was evaluated by qRT-PCR. Shown is the relative mean expression ± SD of 4 replicate measurements. HEXIM, a target known to increase with JQ1 treatment, was used as a control. *, P < 0.05, Mann-Whitney test. (G) ChIP-qPCR was performed on two AML cell lines after treatment with 1 µM JQ1 for 48 h. Shown is fold enrichment over input. Error bars represent four calculations based on two replicates. Binding at NPM1 promoter region was measured as a positive control and binding at ZIC3 promoter region as a negative control. Data show a representative experiment of two individual experiments.

