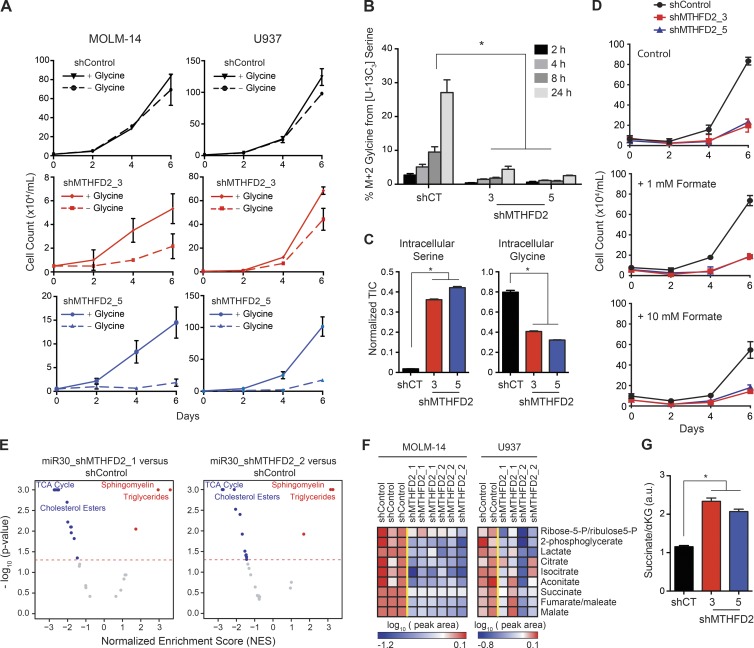
Figure 8.
Suppression of MTHFD2 increases glycine dependence, depletes intermediates of the TCA cycle and alters the succinate to α-ketoglutarate ratio. (A) MTHFD2 knockdown using shRNA resulted in an increased dependence on exogenous glycine in two AML cell lines. Graphs depict cell number as measured by trypan blue exclusion. Shown are the means ± SD of 3 replicates. (B) MTHFD2 suppression results in failure to produce glycine from serine in MOLM-14 cells. After MTHFD2 suppression, MOLM-14 cells were cultured in glycine free media in the presence of [U-13C3]Serine (all three carbons labeled with 13C). Media was extracted at the time points shown and M+2 glycine (both carbons labeled with 13C) was measured by GC-MS. (*) represents P < 0.05 at each time point for hairpins shMTHD2_3 and shMTHFD2_5 relative to shControl, Wilcoxon rank sum test. Shown are the mean ± SD of three replicates. (C) Amounts of intracellular serine and glycine (total ion counts, TIC) from MOLM-14 cells cultured in complete media for 24 h after MTHFD2 suppression, as measured by GC-MS, and then normalized to norvaline as an internal standard. Shown are the mean ± SD of 3 replicates. (*) represents P < 0.05 for hairpins shMTHD2_3 and shMTHFD2_5 relative to shControl, Wilcoxon rank sum test with continuity correction. (D) Suppression of MTHFD2 affects growth of AML cells that are not rescued by formate supplementation in the MOLM-14 cell line. Viability measured by Trypan blue exclusion over a time course with MTHFD2-directed shRNA versus control shRNA. Shown are the mean ± SD of three replicates. (E) MSEA showing metabolic pathways differentially altered by MTHFD2 suppression. Shown is data for MOLM-14 cell line. Blue dots represent pathways that are significantly depleted and red dots represent pathways that are significantly enriched (P < 0.05, permutation test in MSEA). (F) Heat map showing changes in glycolysis intermediates, lactate, and TCA cycle intermediates. Metabolites were selected if they were significantly (P < 0.05, Student’s t test) decreased in MOLM-14 cell line. (G) Ratio of intracellular succinate to α-ketoglutarate (a.u.) in MOLM-14 cells cultured in complete media for 24 h after MTHFD2 suppression, as measured by GC-MS. Shown is the mean ± SEM of three replicates. *, P < 0.05 for hairpins shMTHD2_3 and shMTHFD2_5 relative to shControl, Wilcoxon rank sum test with continuity correction.

