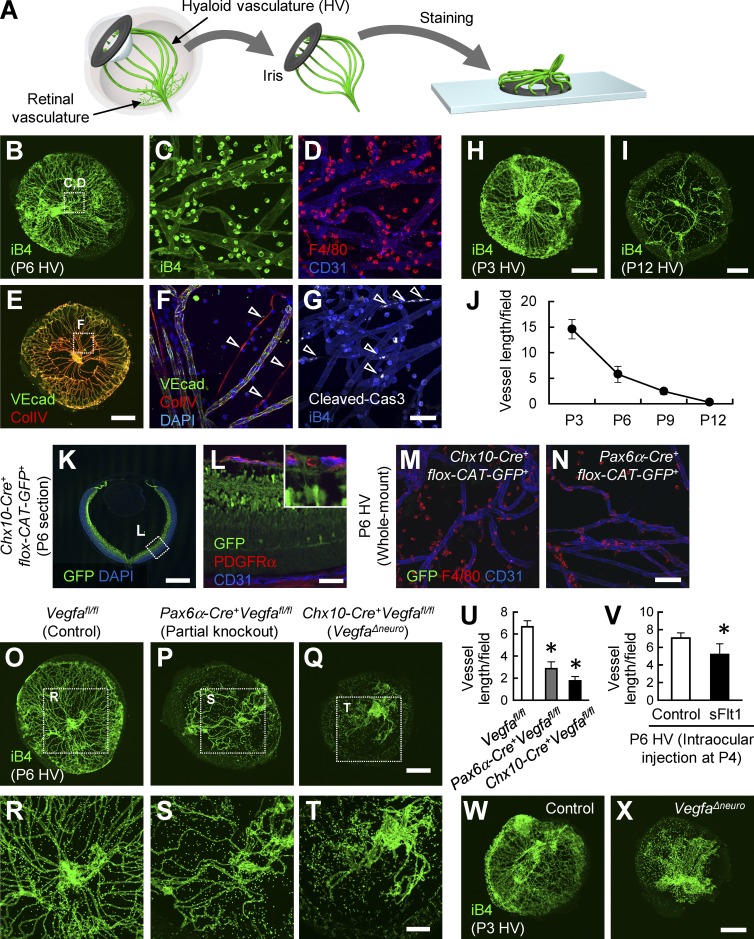
Figure 1.
Neuronal VEGF expression correlates with the number of hyaloid vessels. (A) Schematic diagram depicting the technique used to visualize the hyaloid vasculature. (B–J) Whole-mount stained images of hyaloid vessels at P3, P6, or P12 and quantification (n = 4). Spontaneous vessel regression (arrowheads in F) and apoptosis (arrowheads in G) are indicated. VEcad, vascular endothelial cadherin. (K–X) Immunohistochemical images of a retinal section (K and L) and hyaloid vessels (M–T, W, and X) and quantification (n = 4). Bars: (B, E, H, I, K, O–Q, W, and X) 500 µm; (R–T) 200 µm; (C, D, F, G, and L–N) 50 µm. *, P < 0.05; two-tailed Student’s t tests. Representative confocal images from four independent experiments (four mice per group) are shown. Data are represented as mean ± SD. CAT, chloramphenicol acetyltransferase; PDGFRα, platelet-derived growth factor receptor α.

