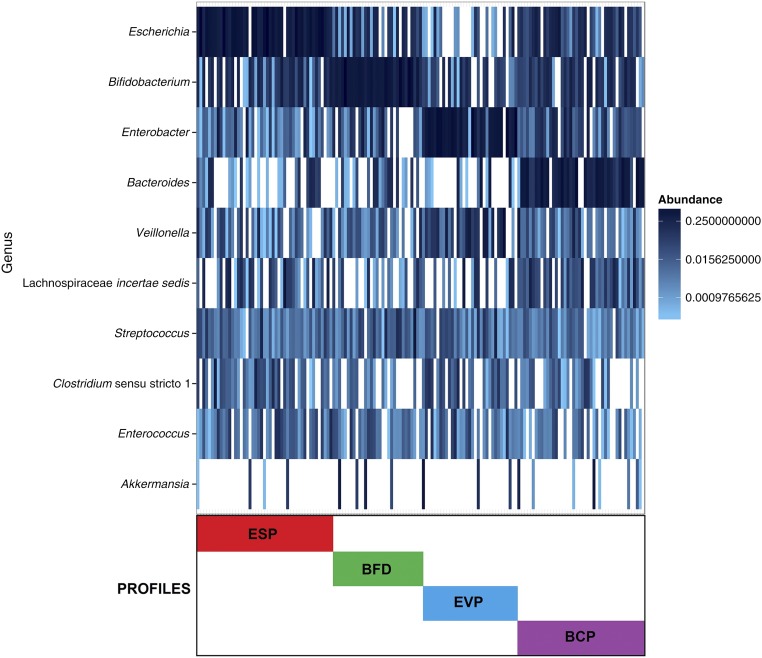
FIGURE 1.
Clustering and composition of fecal microbiota in 155 infants. All fecal microbiota profiles of cases and controls were clustered via partitioning around medoids clustering method with Bray–Curtis distance. Colored bars indicate 4 microbiota profiles: Escherichia-dominant profile (ESP; red), Bifidobacterium-dominant profile (BFD; green), Enterobacter/Veillonella-dominant profile (EVP; blue), and Bacteroides-dominant profile (BCP; purple). The optimal number of clusters was identified by use of the gap statistic. To obtain additional information about the bacterial composition of samples within microbiota profiles, the 10 most abundant genera present in an adjacent heatmap were displayed. The taxonomy depicted is on the genus level because our sequences were dominated by 1 OTU per genus.

