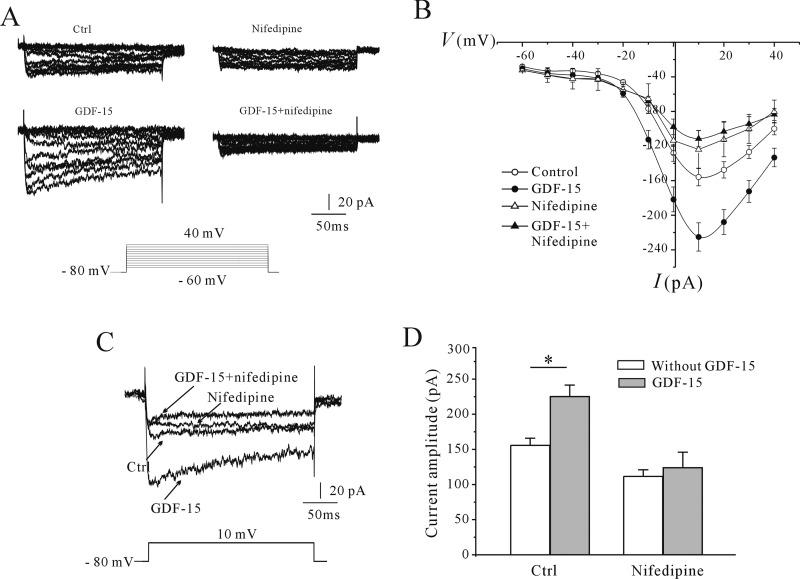
Figure 4. Effect of nifedipine on ICa in control and GDF-15-treated CGNs.
(A) Representative traces obtained with a steady-state voltage protocol of control and GDF-15-treated CGNs in the presence or absence of nifedipine. (B) I–V curve of ICa. Results were obtained from six independent experiments and are means±S.E.M. *P<0.05. (C) Representative traces of control and GDF-15-treated CGNs in the presence or absence of nifedipine. ICa was elicited with depolarizing pulses to 10 mV from a holding potential of −80 mV. (D) Statistical analysis of the effect of nifedipine on ICa. Results are means±S.E.M. *P<0.05 for the two groups connected with a straight line. Ctrl, control.

