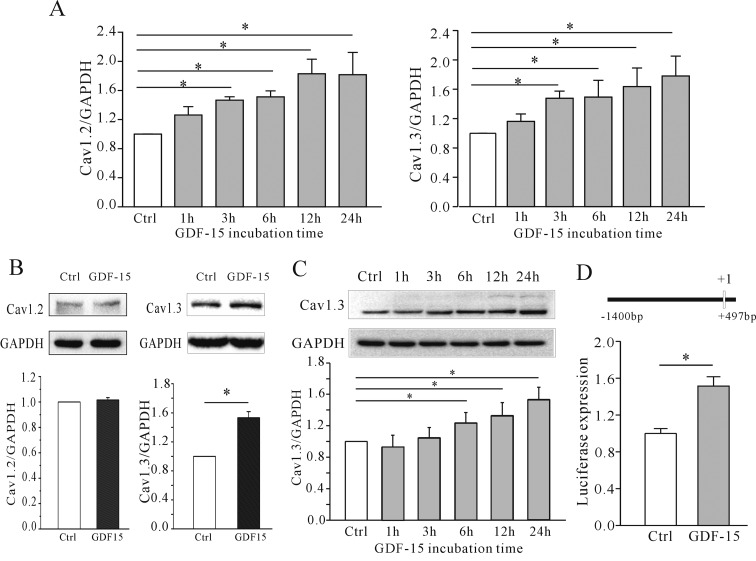
Figure 5. Effect of GDF-15 on Cav1.2 and Cav1.3 expression in CGNs.
(A) Statistical analyses of Cav1.2 and Cav1.3 mRNA levels detected using qPCR. CGNs were incubated with GDF-15 from 15 min to 36 h. (B) Western blot and statistical analyses of the effect of GDF-15 on Cav1.2 and Cav1.3 expression in CGNs. (C) Western blot and statistical analyses of Cav1.3 levels in CGNs after incubation with GDF-15 for 15 mins to 36 hrs. (D) Statistical analyses of the effect of GDF-15 on Cav1.3 promoter expression in CGNs determined by luciferase reporter assays. Promoter information is illustrated. Results are means±S.E.M. *P<0.05 for the two groups connected with a straight line. Ctrl, control.

