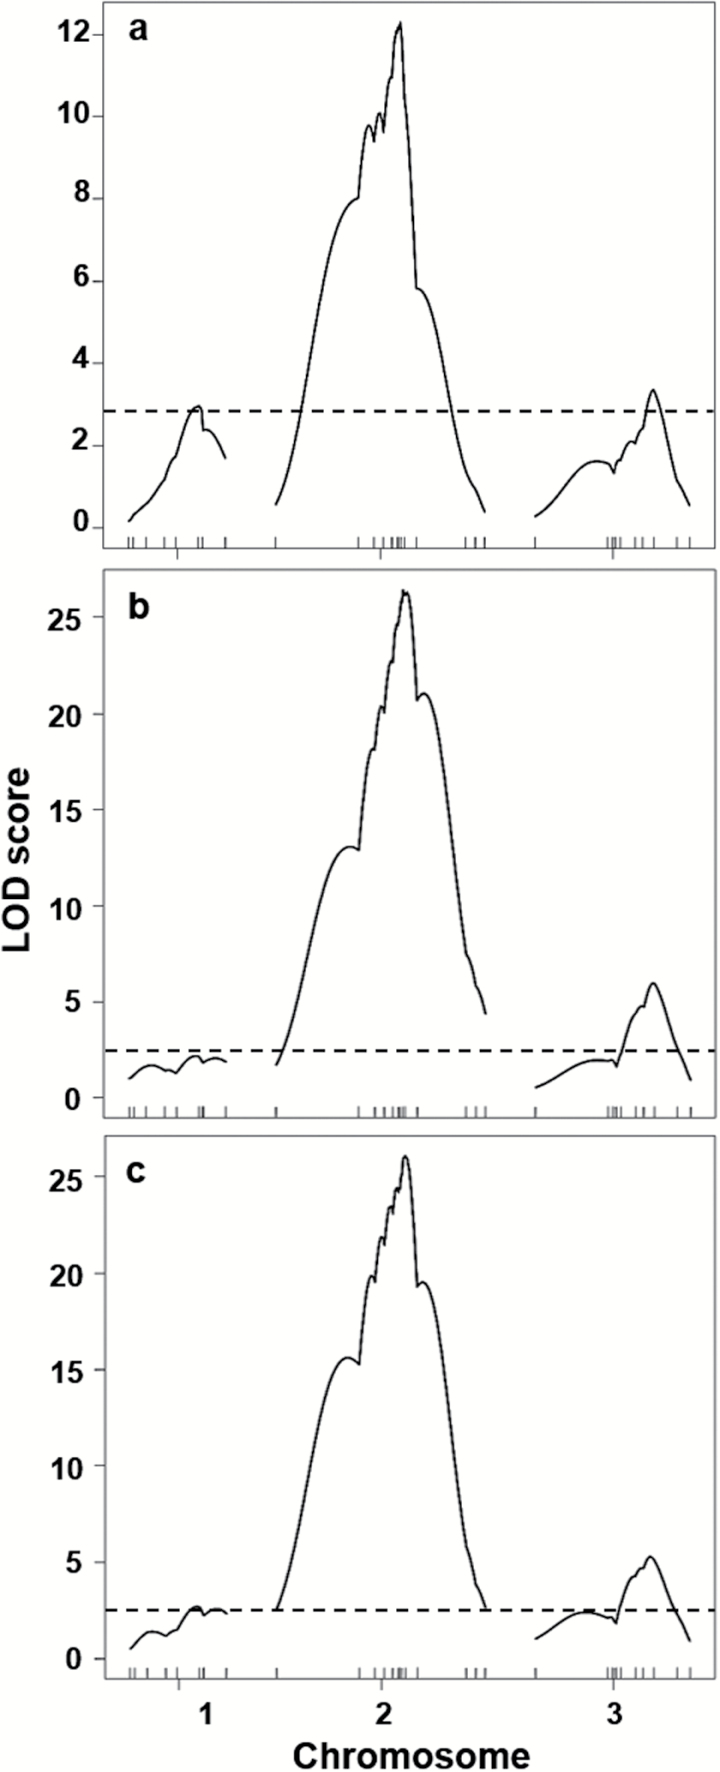
Figure 4.
LOD score profiles identifying QTL for abdominal scale phenotype classifications A, B, and C, respectively. The horizontal line represents the experimentwise threshold value (P = 0.05) for identifying a QTL based on 1000 permutations. See Figure 2 and Supplementary Table S1 online for information on marker loci.

