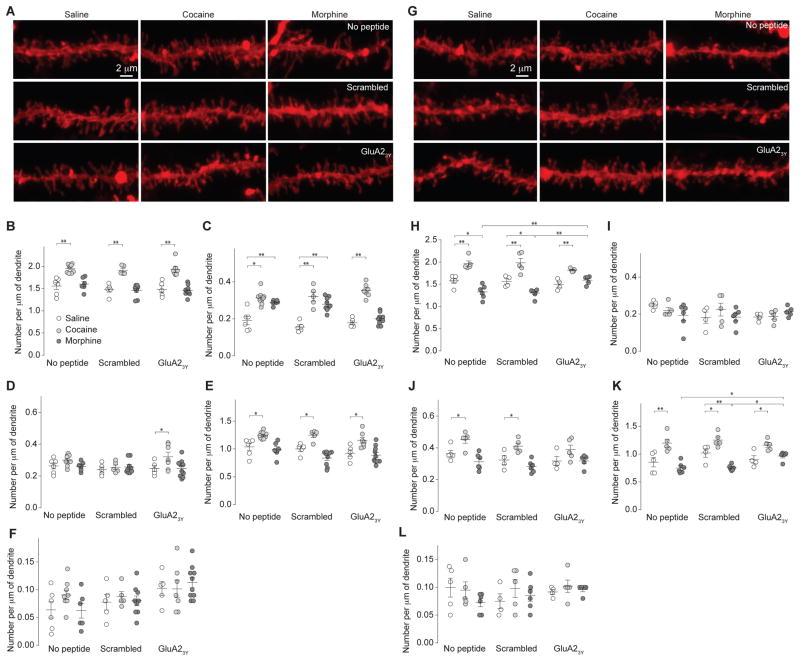
Figure 5. Drug-induced alterations in spine morphology of mouse NAc MSNs.
a–f: 1d withdrawal. a Example NAcSh dendrites from saline (n=16 mice)-, cocaine (n=21 mice)-, or morphine (n=25 mice)-exposed mice with or without co-administration of peptides. b Summary showing that density of total spines was increased in cocaine-exposed mice (F2,53=62.09, p=0.00). c Summary showing that density of filopodia-like spines was increased in cocaine- and morphine-exposed mice, and morphine-induced increase was prevented by GluA23Y co-administration (F2,53=87.71, p=0.00). d Summary showing that density of mushroom-like spines was not affected in cocaine- or morphine-exposed mice (F2,53=4.42, p=0.02). e Summary showing that density of long-thin spines was increased in cocaine-exposed mice (F2,53=31.49, p=0.00). f Summary showing that the density of stubby spines was not altered in any experimental group (F2,53=0.81, p=0.45). g–l: 21d withdrawal. g Example NAcSh dendrites from saline (n=13 mice)-, cocaine (n=15 mice)-, or morphine (n=17 mice)-exposed mice. h Summary showing that density of total spines was increased in cocaine-exposed mice, but decreased in morphine-exposed mice, and GluA23Y co-administration prevented the morphine effects (F2,36=60.97, p=0.00). i Summary showing that density of filopodia-like spines was not affected in cocaine- or morphine-exposed mice (F2,36=0.33, p=0.72). j Summary showing that density of mushroom-like spines was increased in cocaine-exposed mice (F2,36=20.65, p=0.00). k Summary showing that density of long-thin spines was increased in cocaine-exposed mice (F2,36=37.17, p=0.00). l Summary showing that density of stubby spines was not altered in any experimental group (F2,36=1.03, p=0.37). Two-way ANOVA with Bonferroni posttest was used in all above statistics. Error bar=s.e.m., *p<0.05, and **p<0.01.

