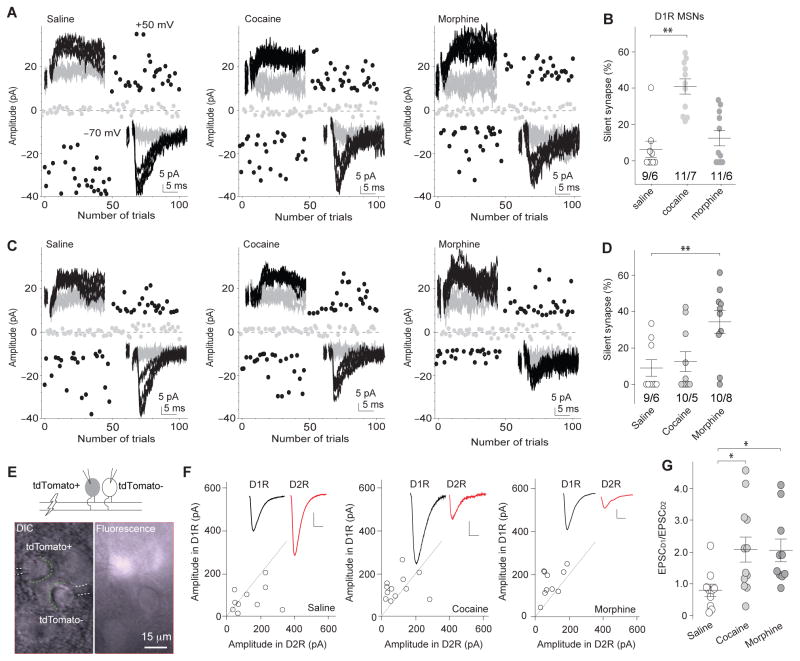
Figure 6. Cell type-specific generation of silent synapses after exposure to cocaine or morphine remodels excitatory circuits in the NAc.
a Example EPSCs evoked by minimal stimulations and their trial plots in D1R NAcSh MSNs from mice 1d after saline (n=9/6 cells/mice), cocaine (n=11/7 cells/mice), or morphine (n=11/6 cells/mice) administration. b Summary showing that exposure to cocaine, but not morphine, generated silent synapses in D1R NAcSh MSNs (F2,28=18.42, p=0.00, one-way ANOVA with Bonferroni posttest). c Example EPSCs evoked by minimal stimulations and their trial plots in D2R NAcSh MSNs from mice 1d after saline (n=9/6 cells/mice), cocaine (n=10/5 cells/mice), or morphine (n=10/8 cells/mice) administration. d Summary showing that exposure to morphine, but cocaine, generated silent synapses in D2R NAcSh MSNs (F2,26=6.14, p=0.01, one-way ANOVA with Bonferroni posttest). e Illustration and images of dual recordings (n=32/9 slices/mice), in which the same stimulation-evoked EPSCs were simultaneously sampled from neighboring tdTomato+ and tdTomato- neurons. f Peak amplitudes of EPSCs in D1R MSNs plotted against those of simultaneously recorded in neighboring D2R MSNs in saline (n=10/3 slices/mice)-, cocaine (12/3 slices/mice)-, and morphine (10/3 slices/mice)-exposed mice 21–28d after saline/drug administration. Insets, EPSCs in D1R (black) and D2R MSNs (red). Scale bars: 50pA, 5ms. g Summary showing the ratio of EPSC amplitudes in D1R MSNs over D2R MSNs (EPSCD1/EPSCD2) was similarly increased 21–28d after cocaine and morphine administration (F2,29=4.57, p=0.02, one-way ANOVA with Bonferroni posttest). Error bar=s.e.m., *p<0.05, and **p<0.01.

