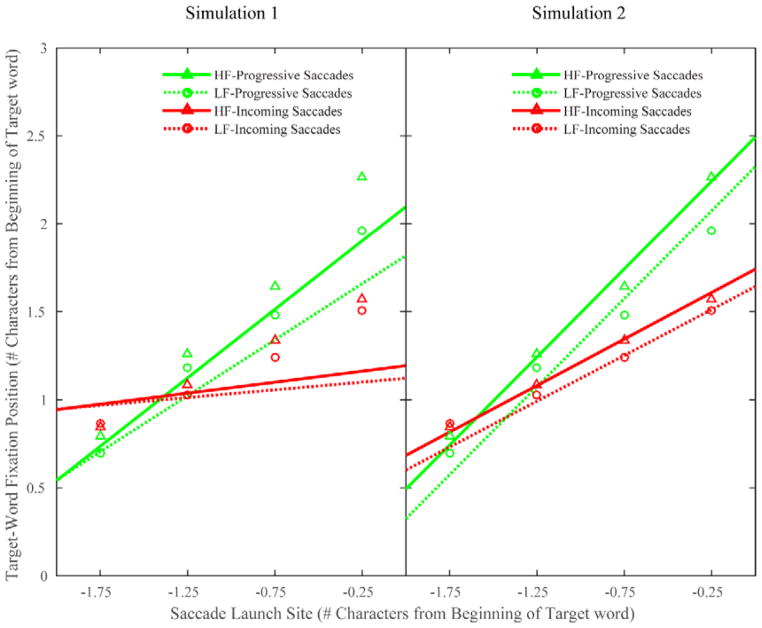
Figure 2.
Observed and simulated relationship between the pre-target saccade launch site and subsequent fixation position for high- and low-frequency target words in the valid-preview condition. The symbols show the observed means and the lines show the simulated results using: (a) the default-target hypothesis (i.e., Simulation 1) and (b) the dynamic-adjustment hypothesis (i.e., Simulation 2). Note that the green symbols and lines show the results using progressive saccades (i.e., irrespective of whether or not the resulting fixation was on the target word), whereas the red symbols and lines show the results of the incoming saccades (i.e., progressive saccades that were followed by target-word fixations).

