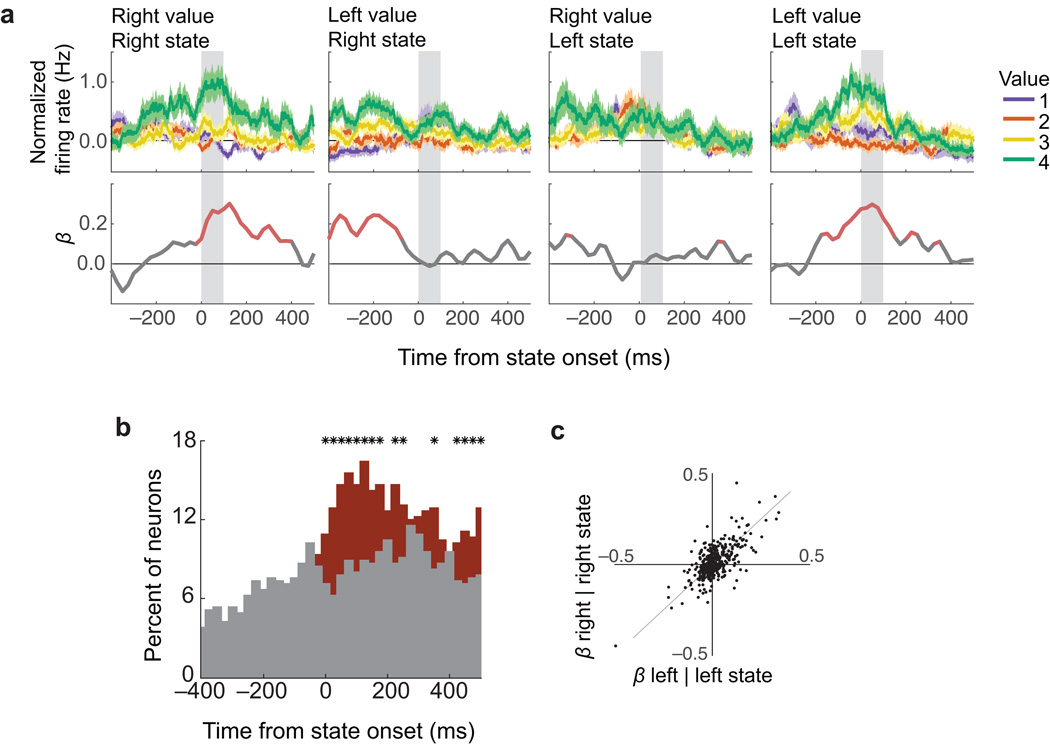
Fig. 8. Single neurons encode current states.
Normalized firing rates of single neurons, re-aligned to the onsets of decoded states. (a) A neuron that encoded current states. In each subplot (average firing rates ± SEM), neuron activity was aligned to states in which the right or left picture was decoded from the rest of the population (Right, Left states respectively). During ‘Right states’, this neuron encoded the value of pictures on the right (Right value), but not left (Left value; first two subplots). During ‘Left states’, it encoded ‘Left values’, but not ‘Right values’. Bottom panels show β coefficients from a multiple regression of firing rate (averaged over 50 ms, stepped by 10 ms) on four factors corresponding to titles on the subplots (e.g. ‘Right value’ during ‘Right states’, etc.). Red: p ≤ 0.01. (b) Percent of neurons encoding current state value (i.e. ‘Right values’ during ‘Right states’ and ‘Left values’ during ‘Left states’) (red) and those encoding the value of the alternate picture (i.e. ‘Right values’ during ‘Left states’ and “Left values’ during ‘Right states’) (gray). Significance was defined by non-zero β coefficients in a multiple regression (p ≤ 0.01). * = red and gray proportions differ (χ2 test, p ≤ 0.01). (c) Across all neurons, β coefficients in the first 100 ms after state onset for ‘Right values’ during ‘Right states’ (right | right) were correlated with ‘Left values’ during ‘Left states’ (left | left) (r2 = 0.55, p = 6×10−81; gray line = unity).

