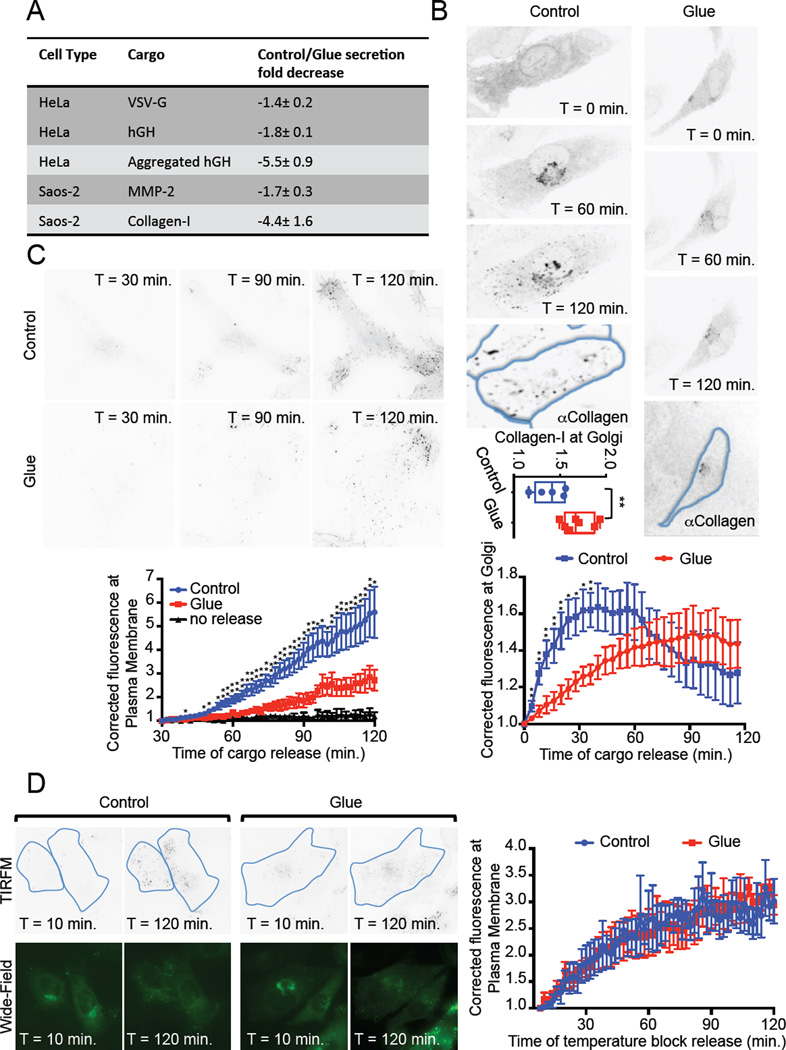
Figure 2. Cargo transport through glued Golgi.
A. Table summarizing bulk transport experiments results performed on different cargoes and different cell lines (see Fig. S2 and S3). B. Saos-2 cells expressing DsRed-FRB-Golgin97, Grasp55-FKBP, Grasp65-FRB and the model cargo ssGFP-FM4-CD8 (disaggregated form), treated (Glue) or not (Control) with Dimerizer for 16 hours, were subjected to live confocal imaging. Cargo was released by addition of Solubilizer at time 0 min. Fluorescence intensity at the Golgi was monitored, and the average of at least 5 cells taken from 4 independent experiments was plotted. After the 2 hours of live imaging, cells were fixed and immuno-labeled for Collagen-I. The ratio of fluorescence intensity in the Golgi region over the intensity in the whole cell was plotted for each cell analyzed. C. Cells as in B were subjected to TIRF microscopy starting 30 minutes after cargo release (Solubilizer addition). Fluorescence intensity at the plasma membrane was monitored, averaged from at least 5 cells taken from 4 independent experiments and plotted. D. Cells as in C were subjected to a temperature block at 20°C for the first 4 hours of cargo release. Cells were then brought back to 37°C for 5 minutes prior to TIRF imaging as in C. Before and after live imaging, wide-field images were obtained to observe the fluorescence intensity of the cargo in the Golgi. Data from 3 independent experiments (4 cells) was averaged and plotted. *: p<0.1; **: p<0.05.

