
Figure 2.
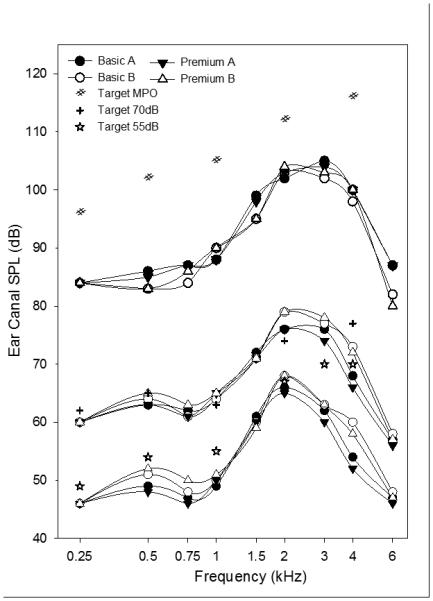
Mean real ear aided responses in the left ear for final hearing aid fittings after all fine tuning adjustments. The lower, middle, and upper sets of curves depict results for soft speech input (55 dB SPL), average speech input (70 dB SPL), and swept tone bursts at 85 dB SPL (to determine narrow-band maximum output), respectively. Each set shows results for each of the four research hearing aids (premium and basic models for each of two brands). Brand A is shown using filled symbols and brand B is shown using open symbols. In addition, mean target values for the NAL-NL2 prescription are shown for each set of curves.