Figure 1.
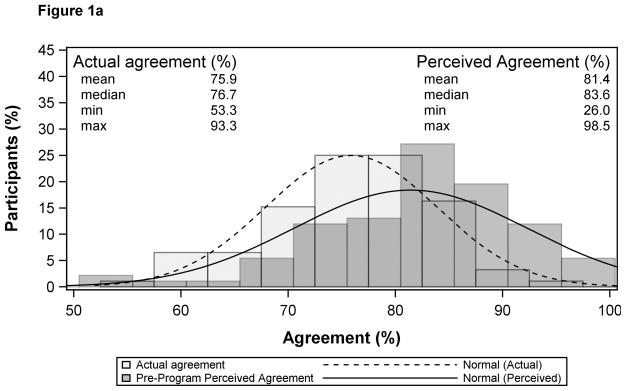
Figure 1a. Distribution of Overall Perceived Agreement and Actual Agreement (n=92)
Note: Extreme values omitted from plot.
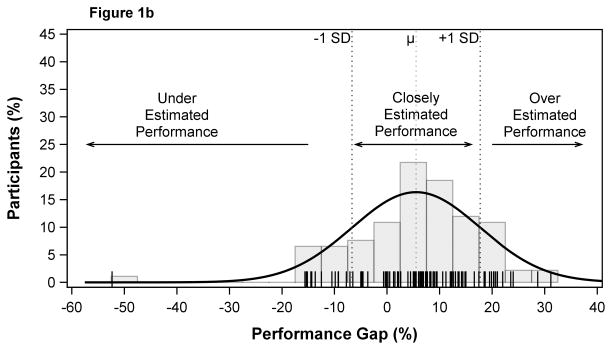
Figure 1b. Distribution of Performance Gap (n=92)
Wilcoxon signed-rank test (Ho: mean of the difference = 0): p<0.001.
Performance gap mean (μ) and standard deviation is 5.5% (12.2%)
Under Estimated Performance occurs below -6.7% and Over Estimated Performance occurs above 17.7%


