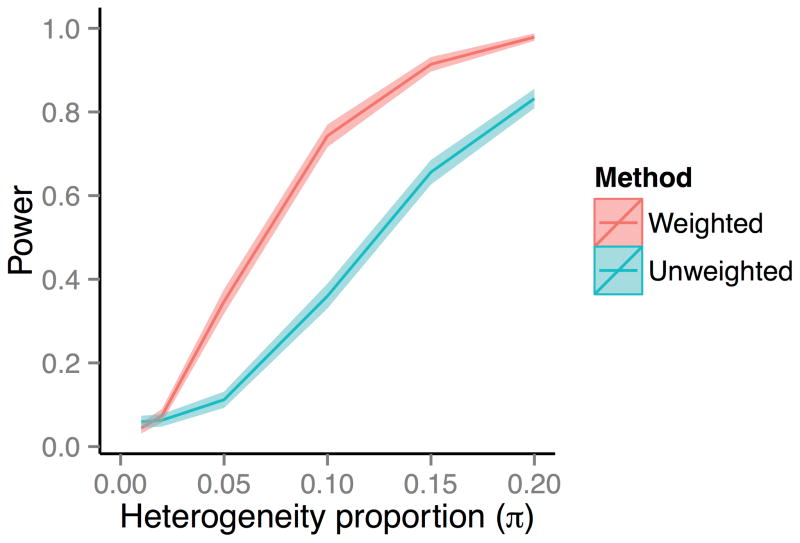
Figure 2. Power gain by weighting SNPs by allele frequency and effect size.
We compared the statistical power of BUHMBOX with a weighting scheme that optimally weights correlations between SNPs (weighted) to an alternative approach that weights correlations uniformly (unweighted; equation (12) in Supplementary Note). We simulated 1,000 case individuals and assumed 50 risk loci, whose OR and RAFs were sampled from the GWAS catalog. Colored bands denote 95% confidence intervals of power estimates.

