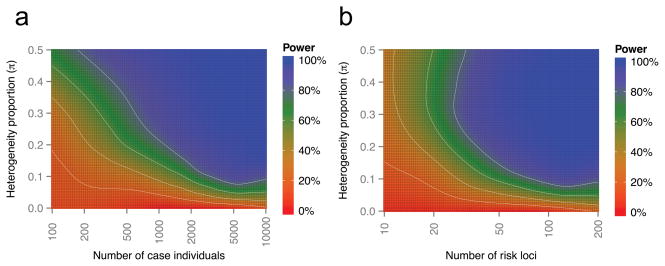
Figure 3. BUHMBOX power analysis.
Power of BUHMBOX for detecting heterogeneity as a function of the number of risk loci, number of case samples, and the proportion of samples that actually have different phenotype (heterogeneity proportion, π). We assume that we have the same number of controls as cases. White lines denote 20, 40, 60, and 80% power. (a) Power as a function of number of case individuals and heterogeneity proportion, when the number of risk loci is fixed at 50. (b) Power as a function of number of risk loci and heterogeneity proportion, when the case sample size is fixed at 2,000.

