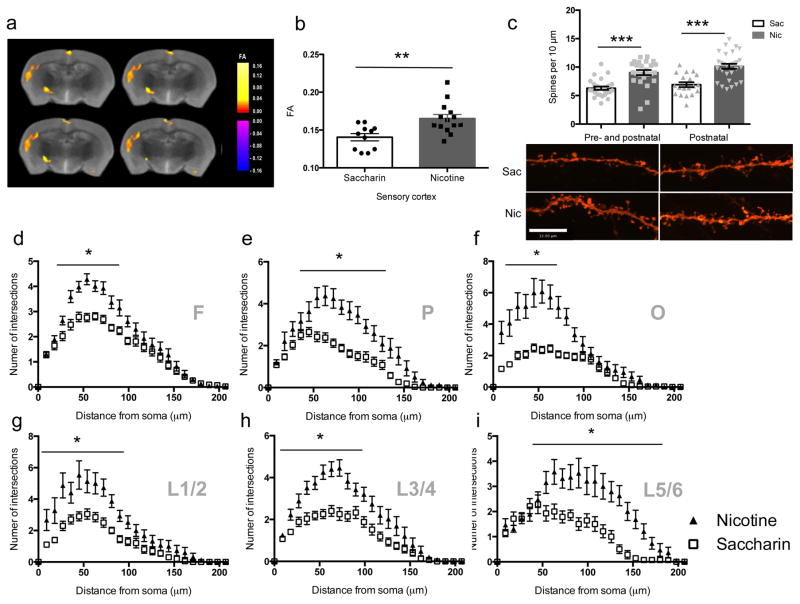
Figure 1. Morphological changes in cortical neurons induced by developmental nicotine exposure.
Voxel-based analysis of FA changes induced by nicotine treatment during development measured by DTI (diagram from the Paxinos atlas 43 identifies affected regions). Two-tail t-tests of average FA values in nicotine and saccharin groups indicate a significant difference (n = 5 brains/condition; t(23) = 3.310, p = 0.00305573) in cortical regions investigated, including (a) somatosensory cortex and (b) sensory cortex. (c) Nicotine significantly increases spine density in nicotine treated groups compared to controls (pre- and postnatal: Sac (n = 26 slices from 6 mice), Nic (n = 25 slices from 5 mice), t49 = 5.151, p = 0.00000460; postnatal-only: Sac (n = 19 slices from 6 mice), Nic (n = 29 slices from 6 mice), t46 = 4.961, p = 0.00001002). (d–i) The number of intersections was assessed for the apical dendritic tree. Scale bar = 12 μm. (d) Frontal (F) cortical regions: (F(1,113) = 9.019, p = 0.00329026). The (e) parietal (P) and (f) occipital (O) regions of cortex showed a significantly higher number of intersections following nicotine exposure compared to the control group. (e) F(1,48) = 31.924; p = 0.00000085. (f) F(1,38) = 32.082, p = 0.00000165. (g–i) Layer-specific effects of developmental nicotine exposure on dendritic complexity. (g) Superficial layers of cortex showed the least change in complexity of dendritic arbors following early nicotine exposure (F(1,33) = 20.835, p = 0.0000661). Layers (h) 3/4 (F(1,85) = 25.927, p = 0.00000210) and (i) 5/6 (F(1, 30)=17.452, p = 0.00020270) show significant nicotine-induced increases in dendritic arborization compared to the control group. *, p < 0.05. Frontal (Sac, n = 41; Nic, n = 73), Parietal (Sac, n = 29; Nic, n = 23), Occipital (Sac, n = 23; Nic, n = 25), L1/2 (Sac, n = 20; Nic, n = 15), L3/4 (Sac: Sac, n = 36 ; Nic, n = 53), L5/6 (Sac, n = 14; Nic, n=18). “n” represents number of slices from 6 mice. Error bars represent s.e.m.

