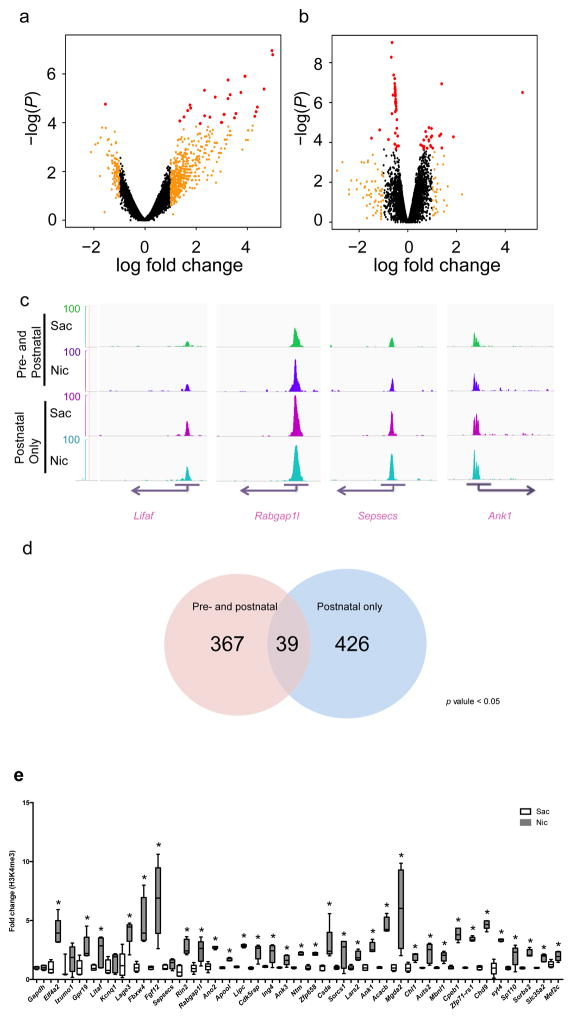
Figure 3. Differential enrichment of H3K4me3 at promoter sites associated with synapse function following developmental nicotine exposure. (a,b).
Scatterplots of relative enrichment level, degree of (fold) change, and P values (nominal p value cutoffs) of all 14,881 identified genomic sites in the pre- and postnatal, and postnatal-only, nicotine treated groups. Dots in red indicate genomic loci for which adjusted. p < 0.05 (c) Genome browser tracks of H3K4me3 epigenetic marks at four selected genomic sites (Litaf, Rabgab1l, Sepsecs, and Ank1). Images were acquired using igvtools integrated genome browser and confirmed with UCSC genome browser. The peak distribution pattern of each replicate of a representative locus is shown in supplementary Fig. 3b. (d) ChIP-seq analysis identified 367 differentially enriched peaks in cortical samples from mice exposed to nicotine during the pre- and postnatal periods, and 426 differentially enriched peaks in cortical samples from mice exposed to nicotine only in the postnatal period, with adjusted p values < 0.05. (e) Verification of identified gene loci that were enriched following both nicotine exposure regimens using ChIP-PCR showed that 36 of 39 genomic sites identified in the ChIP-seq analysis were differentially methylated in independent samples following pre- & postnatal nicotine exposure compared to the control group (*, p < 0.05; ***, p < 0.01 with multiple comparisons; #, p < 0.05; Gapdh: F(1,8) = 0.00, p = 1.000; Eif4a: F(1,8) = 31.364, p = 0.00051003; Izumo: F(1,6) = 0.900, p = 0.37940979; Gpr19: F(1,8) = 9.107, p = 0.01661552; Litaf: F(1,8) = 5.554, p = 0.04619611; kcnq1: F(1,8) = 0.792, p = 0.39946656; Lage3: F(1,8) = 16.418, p = 0.00367444; Fbxw4: F(1,8) = 17.9, p = 0.00287307; Fgf12: F(1,7) = 13.804, p = 0.00750159; Sepsecs: F(1,8) = 7.568, p = 0.02502024; Rin2: F(1,8) = 33.897, p = 0.00039509; Rabgap1l: F(1,8) = 11.344, p = 0.00981340; Ano2: F(1,8) = 107.443, p = 0.00000649; Apool: F(1,8) = 120.782, p = 0.00000418; Lipc: F(1,8) = 893.328, p = 0.00000001; Cdk5rap: F(1,8) = 23.198, p = 0.00132739; Ing4: F(1,8) = 10.019, p = 0.01328880; Ank3: F(1,8) = 11.424, p = 0.00964250; Ntm: F(1,7) = 330.474, p = 0.00000038; Zfp658: F(1,7) = 141.861, p = 0.00000669; csda: F(1,8) = 8.411, p = 0.01988645; Sorcs1: F(1,7) = 5.378, p = 0.05346909; Lars2: F(1,7) = 23.081, p = 0.00195662; Ank1: F(1,7) = 47.436, p = 0.00023397; Acacb: F(1,7) = 128.527, p = 0.00000930; Mgda2: F(1,7) = 10.811, p = 0.01333907; Chl1: F(1,7) = 18.662, p = 0.00348039; Auts2: F(1,8) = 11.318, p = 0.00986976; : F(1,8) = 29.295 Mbnl1, p = 0.00063647; : F(1,8) = 141.042 Cpeb1, p = 0.00000232; Zfp71-rs1: F(1,8) = 830.025, p = 0.0000001; Chd9: F(1,8) = 396.42, p = 0.00000004; Syt4: F(1,8) = 87.029, p = 0.00001422; Sp110: F(1,8) = 7.628, p = 0.02460310; Sorbs2: F(1,8) = 77.526, p = 0.00002176; Slc35a2: F(1,8) = 37.6, p = 0.00027950; Mef2c: F(1,8) = 10.881, p = 0.01088096). Each replicate was a pool of 2–4 brain samples and 5 replicates were used for each condition (Sac: n = 5 pools from 17 animals; Nic: n = 5 pools from 15 animals). Whiskers represent minimum to maximum value of data distribution.

