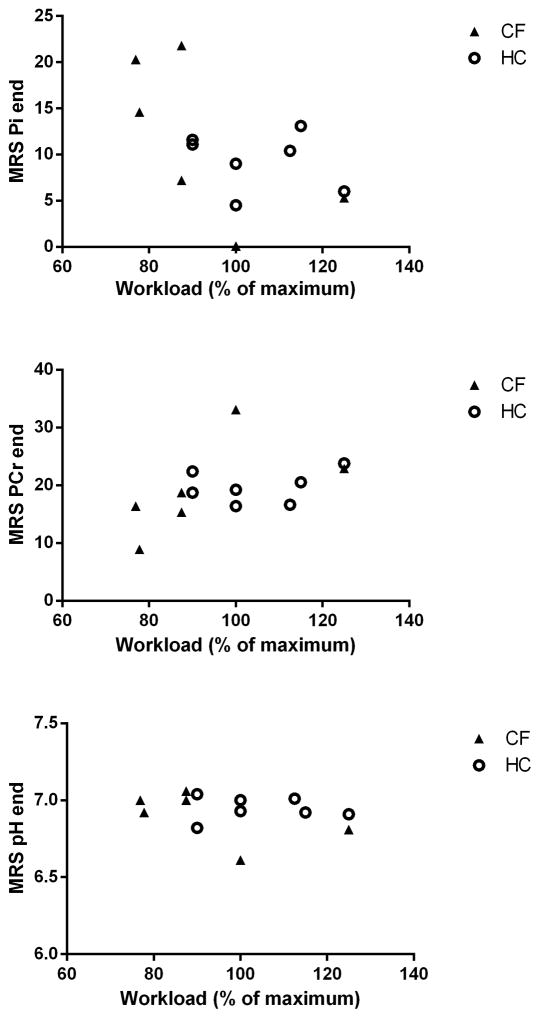
Fig. 2.
Metabolic endpoints of the in-magnet maximal exercise test in the CF patients (solid square symbols) and their age- and sex-matched controls (open circles). A: end-PCr concentration (mM); B: end-Pi concentration (mM); C: end-pH. Quadriceps metabolite concentrations and pH were calculated as described in Methods. The specific endpoints are shown as a function of the maximal workload attained in-magnet compared to testing outside the magnet.

