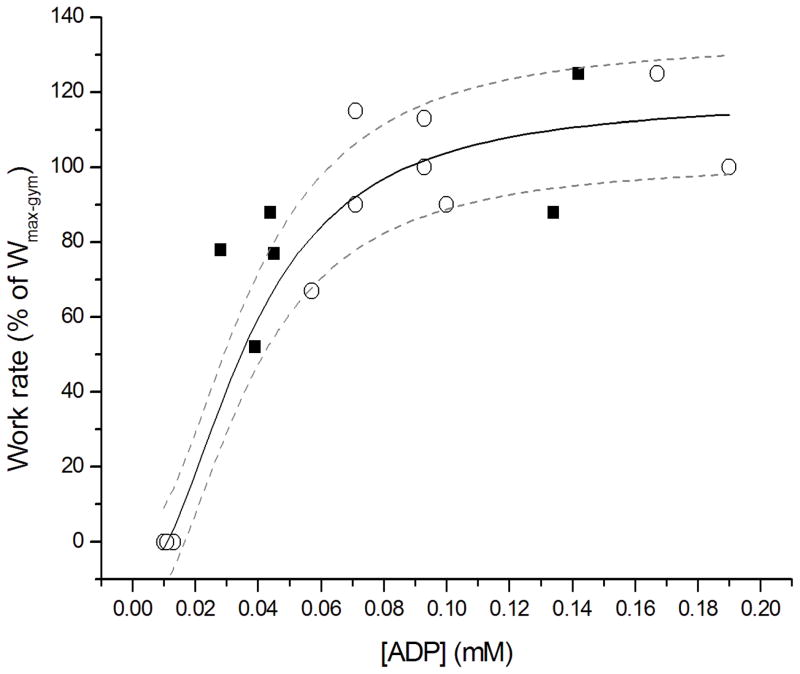
Fig. 4.
Response function of mitochondrial ATP synthesis to ADP concentration changes in exercising quadriceps muscle of CF patients (solid square symbols) and their age- and sex-matched controls (open circles). The rate of mitochondrial ATP synthesis was taken to vary linearly with muscular work rate (Wu et al., 2007). Wmax-gym: maximal work rate attained on the ergometer during a separate exercise test outside the MR scanner. The solid line shows the 3-parameter fit of a sigmoidal Hill relation to the control dataset; dotted lines show the 95% confidence interval of the fit (r2 0.97). Regression equation: y = 127 * ((X/0.037)^2.1)/(1 + (X/0.037)^2.1) − 9.

