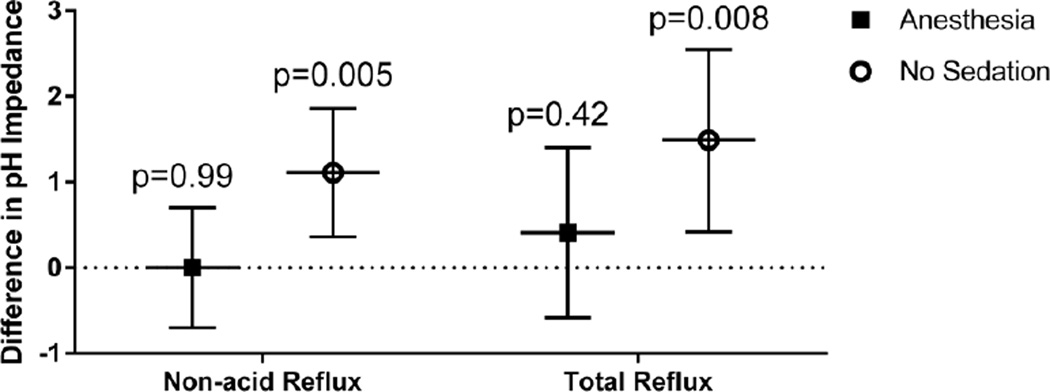
Figure 1.
Mean difference (±95% CI) in pH Impedance between the 1st 4 hours and the abridged data (for number of non-acid reflux episodes/hour and total number of reflux episodes per hour), in patients aged ≥1 year, controlling for opioids, ondansetron, BMI, PPI and esophagitis. p-values are for the comparison of the difference versus a null hypothesis of no difference.

