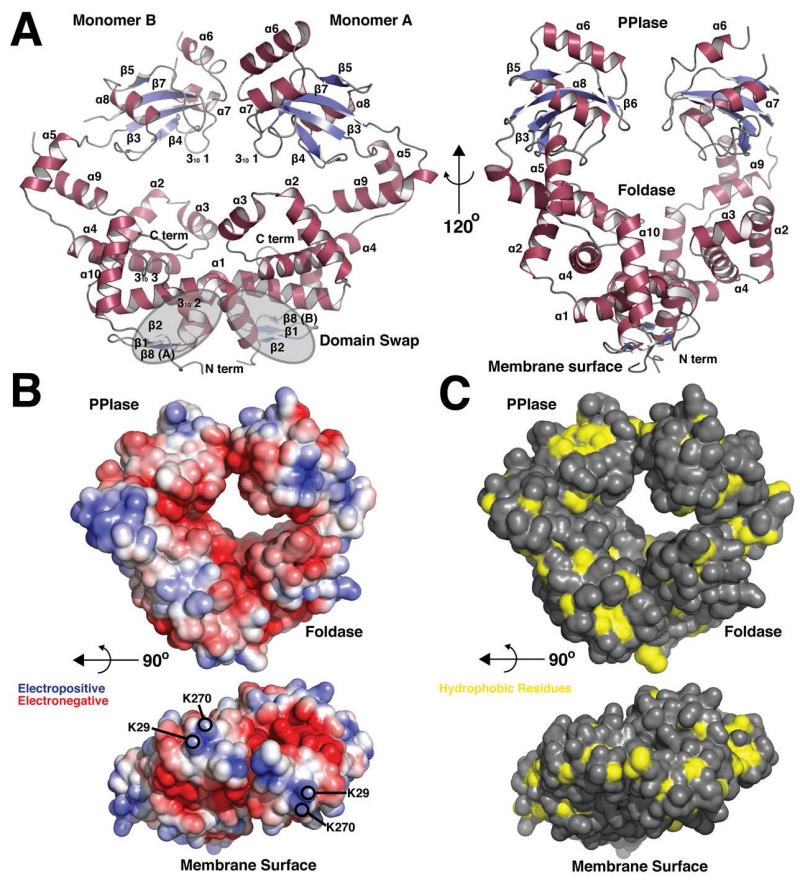
Figure 1. Overall Structure and molecular surface properties of PrsA1.
(A) Cartoon representation of PrsA1 (residues 22-294). Secondary structure elements are displayed in red (α-helix) and blue (β-strand). Grey highlights indicate the domain swap region at the dimer interface. The PPIase domain and Foldase domain are labeled, in addition to the site of contact with the bacterial membrane. Each secondary structure element is labeled in by number order from N to C terminus (α = α-helix, β = β-strand) (B) Surface electrostatic potential generated by the Adaptive Poisoon-Boltzmann Software (APBS). Red represents electronegative and blue electropositive. The contour is −5 to 5 kT/e. The lower panel shows the surface facing the bacterial membrane with lysine residues highlighted. (C) Solvent accessible hydrophobic residues (A, G, I, L, M, F, V) on the surface of PrsA1 are displayed in yellow, all other residues in grey. The lower panel shows the surface facing the bacterial membrane.

