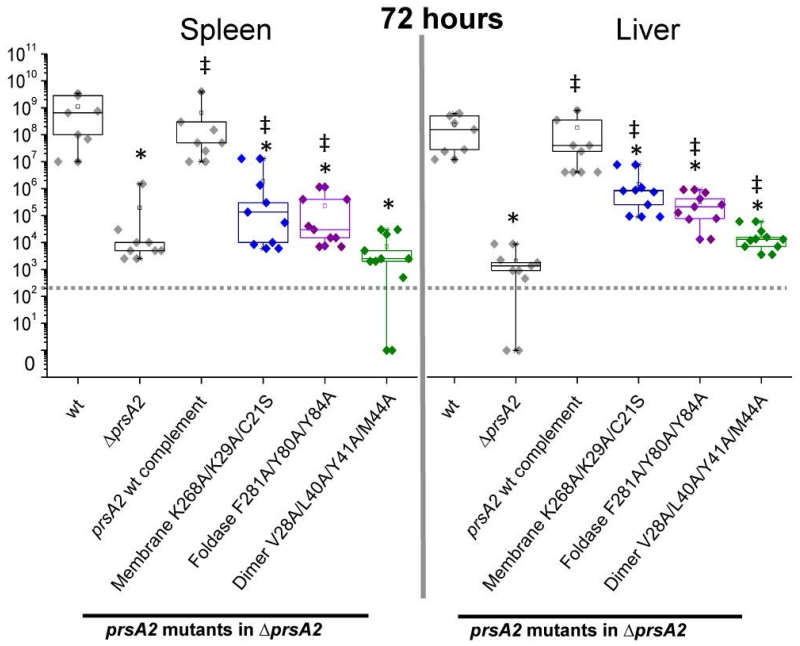
Figure 10. Lm prsA2 mutant virulence phenotypes.
Mice were intravenously infected with 2×10⁴ colony forming units (CFUs) with the indicated reference strains (grey), membrane interface mutant (blue), foldase mutant (purple), and dimer mutant (green). At 72 hours post-infection bacterial burdens were determined for spleens and livers. Box plots are shown where each point represents one mouse. A dotted line indicates the limit of detection. Asterisks and ‡ indicate statistical significance of P≤0.05, by two-tailed Wilcoxon Rank-Sum Test when compared to Lm wt and ΔprsA2, respectively.

