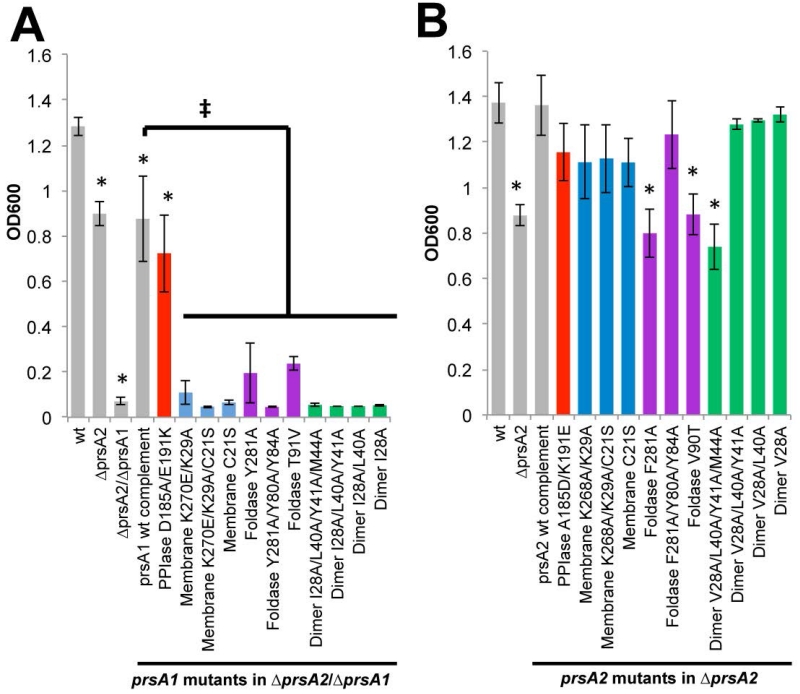
Figure 6. The role of PrsA1 and PrsA2 in resistance to ethanol.
Bacterial growth is shown as the optical density at 600nm (OD600) of strains inoculated from a saturated culture into liquid broth containing 4% ethanol (EtOH) and grown overnight. (A) prsA1 mutants in the ΔprsA2/ΔprsA1 background and (B) prsA2 mutants in the ΔprsA2 background are shown. The grey bars represent the reference strains and the variants are color-coded as Figure 5. Error bars represent the standard error of the mean of 4 independent cultures where P≤0.05 by two-tailed Student’s T-test when compared to Lm wt or prsA1 complement as indicated by an asterisks or ‡, respectively.

