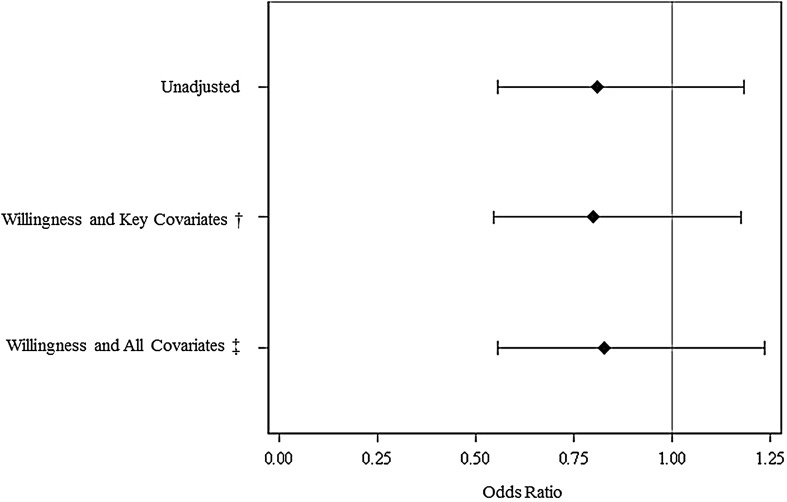
Fig. 2.
The graph shows the odds ratios of referral to an orthopaedic surgeon at 12 months postintervention in unadjusted and adjusted models. *Unadjusted and adjusted odds ratios (95% CI) with the control group as the reference group; †key covariates: age, sex, education, WOMAC; ‡all covariates: key covariates plus Arthritis Self-Efficacy Function score, Charlson comorbidity score, and SF-12 Physical and Mental Component scores.

