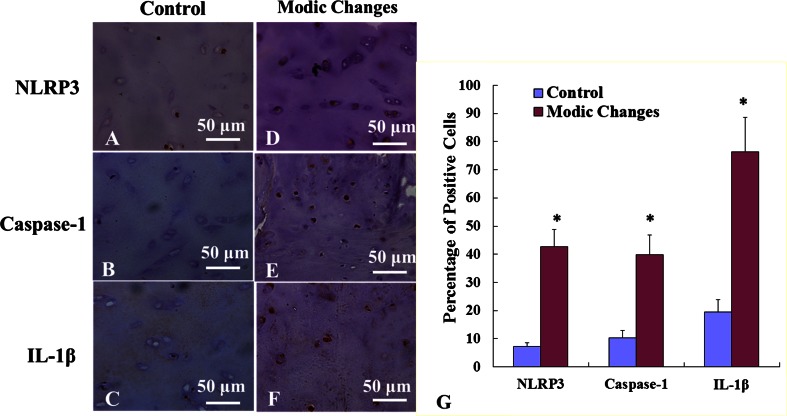
Fig. 3A–G.
Immunohistochemical illustrations for the control group (original magnification, ×400) for (A) NLRP3, (B) caspase-1, and (C) IL-1β and the Modic changes group (original magnification, ×400) for (D) NLRP3, (E) caspase-1, and (F) IL-1β are shown. (G) The percentages of immunopositive cells are shown for NLRP3, caspase-1, and IL-1β. *p < 0.05.

