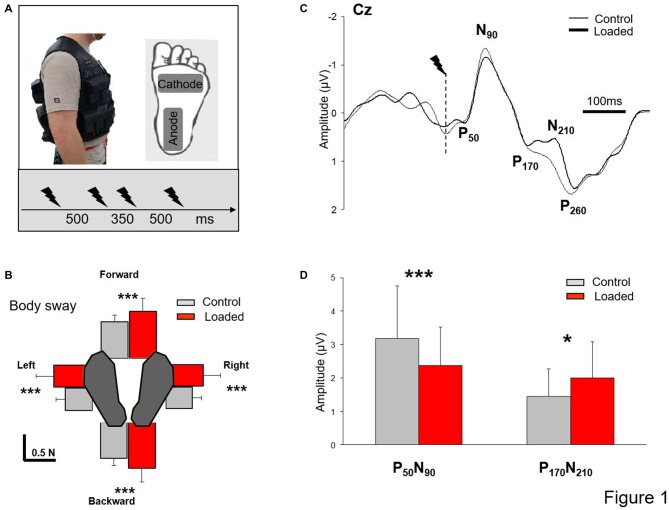
Figure 1.
Somatosensory evoked potential (SEP). (A) Experimental set up. Insert depicts the workout vest worn by the participants; the added weight was distributed on the front and back of this vest. Position of the stimulation electrodes underneath the left foot and time-intervals between stimulations. (B) Mean integral of the horizontal forces in all directions (error bars are standard deviation across participants) ***p < 0.001. (C) Grand average SEP for all participants recorded at Cz in both conditions (Control and Loaded). Dashed line indicates the moment of the stimulation. (D) Mean for the 60 stimulations of the early and late SEPs amplitudes (error bars are standard deviation across participants) ***p < 0.001 and *p < 0.05. Note that the grand average SEP traces at electrode Cz (B) was not representative of the mean value computed for each participant (C).

