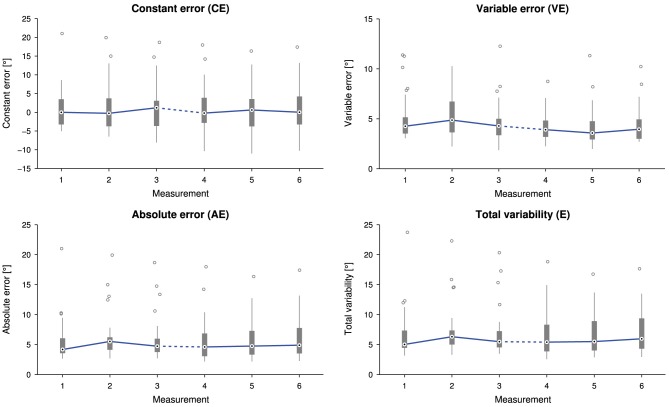
Figure 4.
Tukey box plots for the outcome measures constant error (CE), absolute error (AE), variable error (VE) and total variability (E) as a function of the measurement (32 subjects, i.e., data points, per measurement). Errors were individually averaged across 21 presented angles for each subject and measurement. The solid line connects the medians. The dashed line indicates a longer time interval between the two sessions (M1–3 and M4–6).

