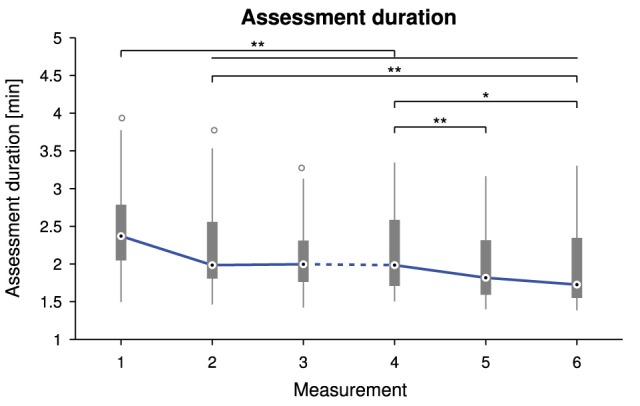
Figure 5.

Tukey box plots for the assessment duration as a function of the measurement time point. The solid line connects the medians. The dashed line indicates a longer time interval between the two sessions (M1–3 and M4–6). Probability values p < 0.05 and p < 0.01 are marked as * and **.
