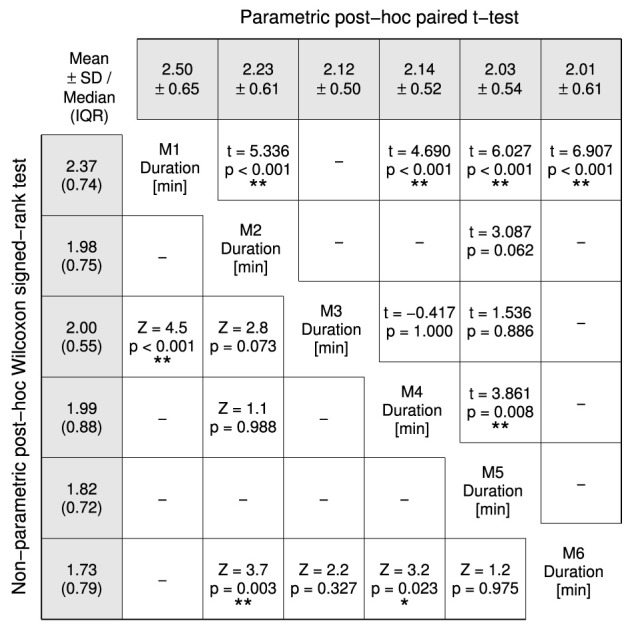
Figure 6.

Post-hoc tests for the Friedman test comparing the assessment durations of the six measurements (M1–6). Non-parametric test results (Z statistic, p-value) are displayed in the lower-left half and parametric test results (t(31) statistic, p-value) in the upper-right half. A Šidák-correction was applied to all post-hoc tests. The gray-shaded fields list mean ± SD in the top row and median (inter quartile range) in the left column. Probability values p < 0.05 and p < 0.01 are marked as * and **.
