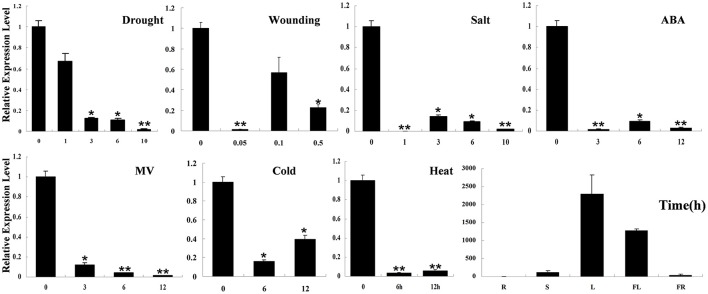
Figure 2.
Expression profiles of HyPRP1 in different tissues (R, root; S, stem; L, leaf; FL, flower; FR, fruit) and in the leaf of S. pennellii LA0716 under various stresses (e.g., drought, salt, heat, cold, and MV) and ABA treatments. All samples were collected at the indicated time points from three biological replicates of each treatment. Single (*P < 0.05) and double (**P < 0.01) asterisks denote statistically significant differences between the stress treatment and the 0 h control. Error bars indicate ± SE of the means (n = 3).

