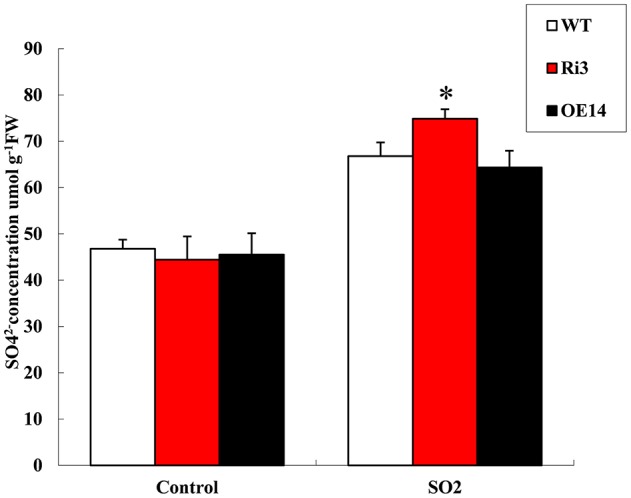
Figure 7.

Sulfate concentration under 10 ppm SO2 treatment for 2 h and untreated leaves from Ri, overexpressed, and WT plants. Data are presented as means ± SE from three technical replications (μmol/g fresh weight). The difference between Ri and WT leaves indicated *P < 0.05.
