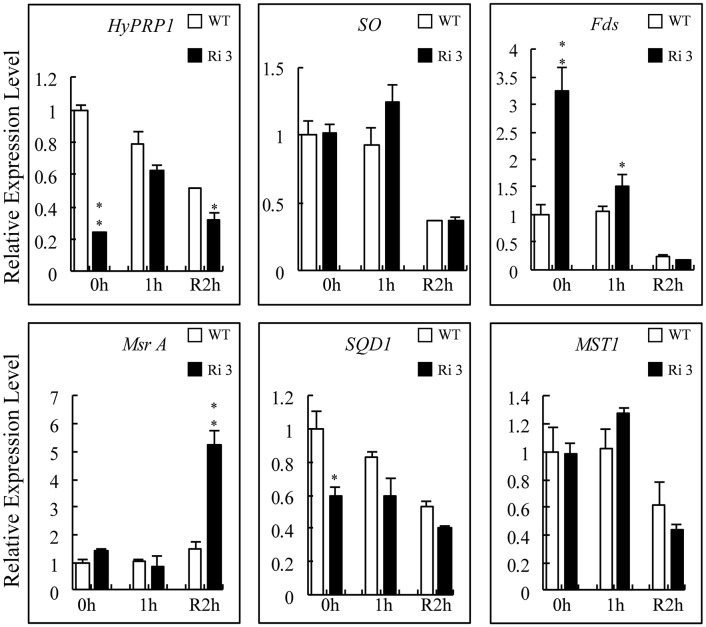
Figure 8.
Expression levels of HyPRP1-interacting genes and tomato sulfite-utilizing genes after SO2 exposure. The expression levels of SO, Fds, Msr A, MST1, and SQD1 were monitored by qRT-PCR analysis using wild-type (WT) and SlHyPRP1-RNAi (Ri) plants sampled immediately after 1 h of 4 ppm SO2 exposure (1 h) and later recovered for 2 h. All samples were collected at the indicated time points from three biological replicates of each treatment. Error bars indicate ± SE of the means (n = 3). The difference between Ri and WT indicated *P < 0.05, **P < 0.01.

