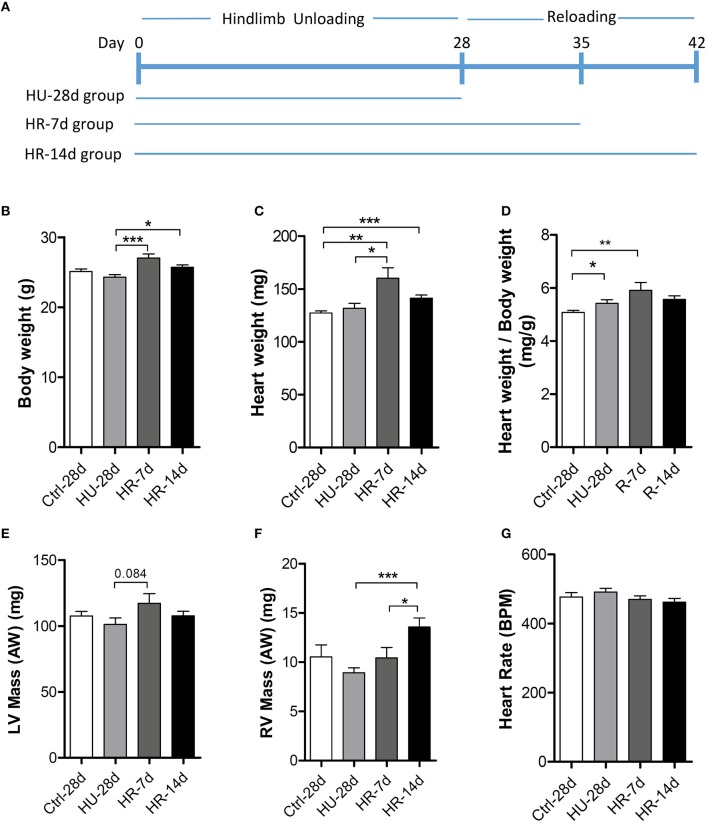
Figure 1.
Heart weight analysis following hindlimb unloading and recovery. (A), Timeline summarizing experimental design. Body weight (B), heart weight (C), ratio of heart weight to body weight (D), LV mass (E), RV mass (F), and heart rate (G) of mice following hindlimb unloading (HU) and recovery. Ctrl-28d, control mice; HU-28d, mice following 28 days of HU; HR-7d, mice following 7 days of recovery after HU; HU-14d, mice following 14 days of recovery after HU. Values are means ± SEM. *P < 0.05, **P < 0.01, ***P < 0.001.

