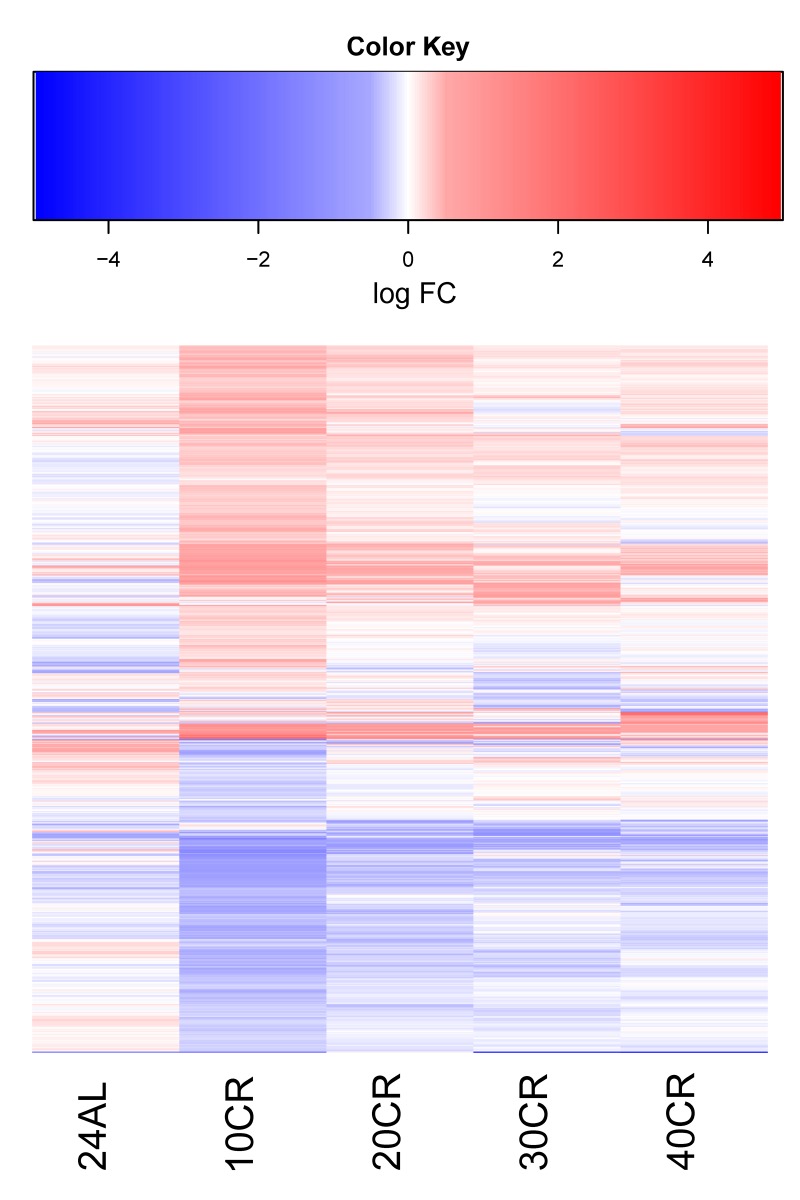
Figure 1.
Log Fold change of differentially expressed genes in at least one treatment relative to 12 hour ad libitum feeding (12AL). Blue indicates down-regulation and red upregulation relative to 12AL. 10CR, 20CR, 30CR and 40CR refer to 10 %, 20 %, 30 % and 40 % restriction and 24AL to 24h ad libitum feeding.

