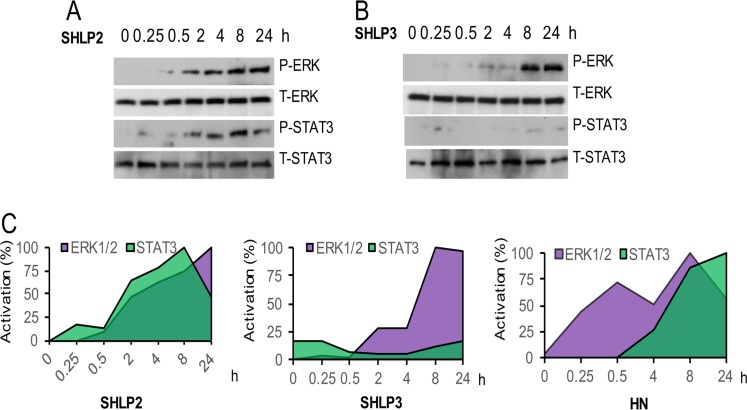
Figure 4. ERK and STAT-3 activation by SHLP2 and SHLP3.
Levels of phospho- and total STAT3 and ERK were assessed in NIT-1 β cells treated with 100 nM (A) SHLP2 or (B) SHLP3. (C) Quantification of ERK and STAT3 levels after treatment with SHLP2, SHLP3, and HN. HN data were derived from Hoang et al., 2009.

