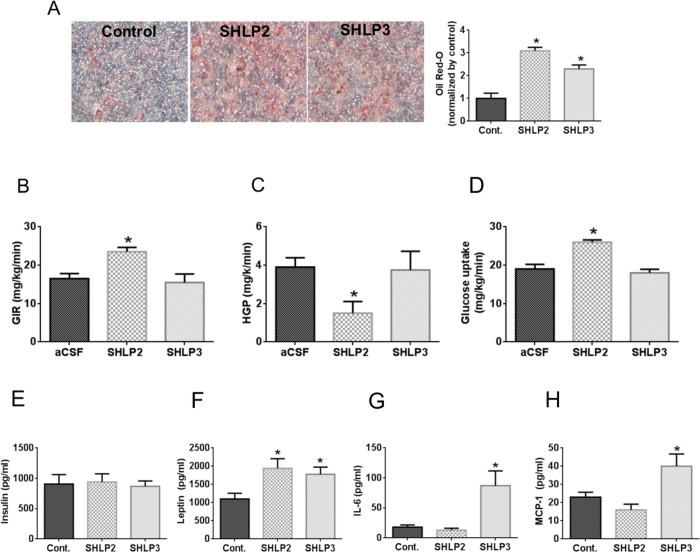
Figure 5. In vitro and in vivo metabolic effects of SHLP2 and SHLP3 on insulin action and pro-inflammatory biomarker expression.
(A) 3T3-L1 pre-adipocyte differentiation was assessed by Oil Red-O staining after incubation with insulin in the presence of control peptide, SHLP2, or SHLP3. (B–D) SHLP2 or SHLP3 were infused by ICV at a rate of 0.16 μg/kg/min into conscious SD rats (n = 6) and glucose flux was studied acutely under systemic pancreatic insulin clamp and physiologic hyperinsulinemic-euglycemic clamp. Glucose infusion rate (B), hepatic glucose production (C), and peripheral glucose uptake (D) were measured. (E–F) C57BL/6 mice (n = 5) were treated with control, SHLP2, or SHLP3 peptides (2 mg/kg/dose, BID, IP) for 5 days. Serum insulin (E), leptin (F), interleukin-6 (G), and monocyte chemotactic protein 1 (MCP-1) (H) levels were measured using LINCOplexTM analysis. All data are presented as means ± SEM. *P < 0.05.

