
Figure 5.
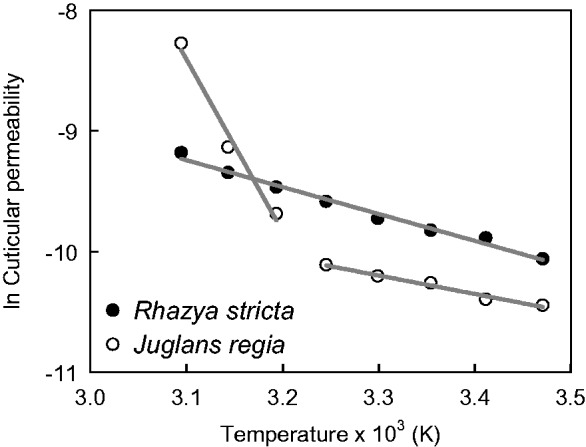
Arrhenius graphs created by plotting the natural logarithm of cuticular permeabilities versus the inverse absolute temperature. Each point represents for a given temperature the mean minimum conductance of Rhazya stricta leaves (ln gmin = –2.332 (±0.338) – (2229.163 (±103.223) × 1/T), ±SE of regression, F = 466.370, P < 0.001, r2 = 0.987, n = 8) and the mean cuticular permeance of Juglans regia leaves (Burghardt and Riederer 2006).