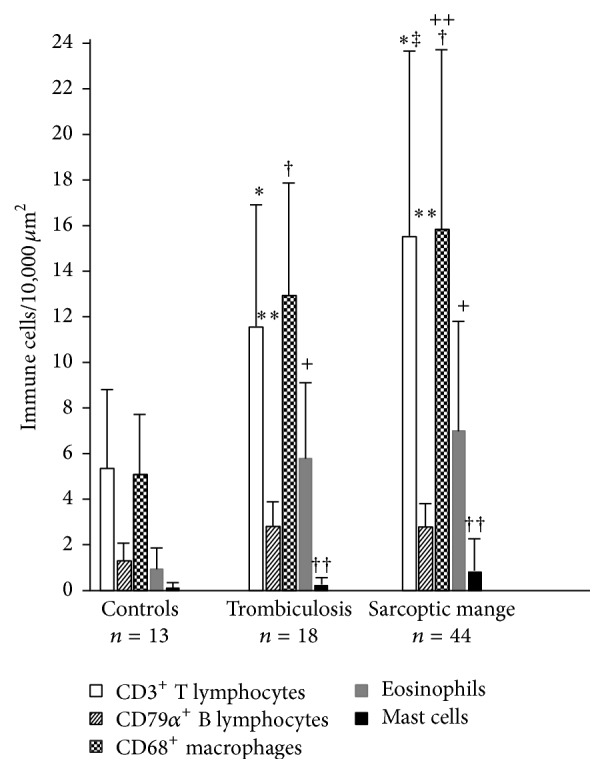
Figure 3.

Histogram of number of immune cells in 10,000 μm2 of skin in control, trombiculosis, and mange affected chamois. Significant differences among CD3+ T lymphocyte (∗), CD79α + B lymphocyte (∗∗), CD68+ macrophages (†), eosinophils (+), and mast cells (††) with controls. Significant differences between CD3+ T lymphocyte (‡) and CD68+ macrophages (++) in chamois with sarcoptic mange and subjects with trombiculosis.
