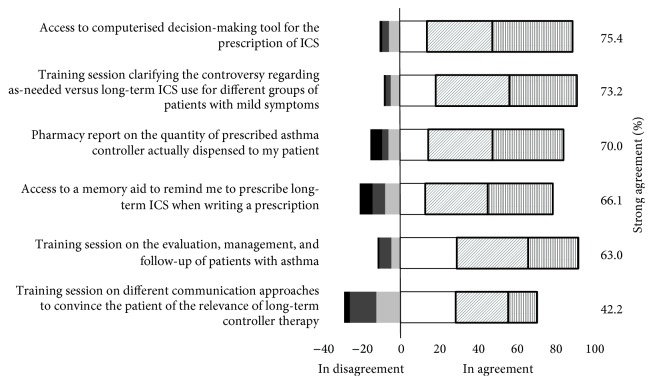
Figure 2.
This histogram depicts the physicians' endorsement, adjusted for the sampling fraction, of each proposed enablers on a Likert-like scale ranging between 5 indicating strong agreement (vertical bars), 4 (diagonal grey bars), 3 (white), 2 (light grey), 1 (medium grey), and 0 indicating strong disagreement (black). The proportion of participants with strong endorsement, that is, answering 4 or 5, is identified by a dark box in the histogram and displayed in the right column.

